None
Note
This tutorial was generated from an IPython notebook that can be accessed from github.
Overlapping regions
Two or more on regions can share the same area - they overlap. One example are region 3 and 4 of the PRUDENCE regions. This notebook illustrates how overlapping regions can be treated in regionmask.
In short
Important
Starting with v0.11.0 regionmask checks if gridpoints belong to more than one region (unless overlap=False). Thus, it creates
the correct mask (or raises an error) per default.
In detail
When creating your own Regions you can tell regionmask if they are
overlapping:
region = regionmask.Regions(..., overlap=overlap)
region = regionmask.from_geopandas(..., overlap=overlap)
where overlap must be one of None (default), True or
False.
For
overlap=Noneregionmask checks if any grid point belongs to more than one region. If so, 2D masks raise and error (because overlapping regions cannot be represented by a 2D mask).mask_3D(...)returns the correct mask.For
overlap=True2D masks raise an error andmask_3D(...)returns the correct mask.If you have two overlapping regions and
overlap=Falseregionmask will silently assign the gridpoints of the overlapping regions to the one with the higher number.Setting
overlaptoTrueorFalseis (slightly) faster than the default ofNone.overlapis correctly set for regions inregionmask.defined_regions.
Example
To illustrate the problem we construct two regions in North America that partially overlap. One is horizontal, the other vertical.
Preparation
Import regionmask and check the version:
import regionmask

regionmask.__version__
'0.12.1.post1.dev10+g9fd2ed6'
Other imports
import cartopy.crs as ccrs
import matplotlib.patheffects as pe
import numpy as np
from matplotlib import colors as mplc
from shapely.geometry import box
Define grid:
ds_US = regionmask.core.utils.create_lon_lat_dataarray_from_bounds(
    *(-160, -29, 2), *(76, 13, -2)
)
Define some colors:
cmap = mplc.ListedColormap(["none", "#9ecae1"])
Define helper function:
def plot_region_vh(mask, region):

    fg = mask.plot(
        subplot_kws=dict(projection=ccrs.PlateCarree()),
        col="region",
        cmap=cmap,
        add_colorbar=False,
        transform=ccrs.PlateCarree(),
        ec="0.5",
        lw=0.25,
    )

    for ax in fg.axs.flatten():
        region[[0]].plot(ax=ax, add_label=False, line_kws=dict(color="#6a3d9a"))
        region[[1]].plot(ax=ax, add_label=False, line_kws=dict(color="#ff7f00"))

        ax.set_extent([-105, -75, 25, 55], ccrs.PlateCarree())
        ax.plot(
            ds_US.LON, ds_US.lat, "*", color="0.5", ms=0.5, transform=ccrs.PlateCarree()
        )
Define overlapping polygons:
coords_v = box(-100, 28, -90, 50)
coords_h = box(-100, 40, -80, 50)
Default behavior (overlap=None)
First test what happens if we keep the default value of
overlap=None:
region_vh = regionmask.Regions([coords_v, coords_h])
Create a mask
mask_vh = region_vh.mask_3D(ds_US)
Plot the masked regions:
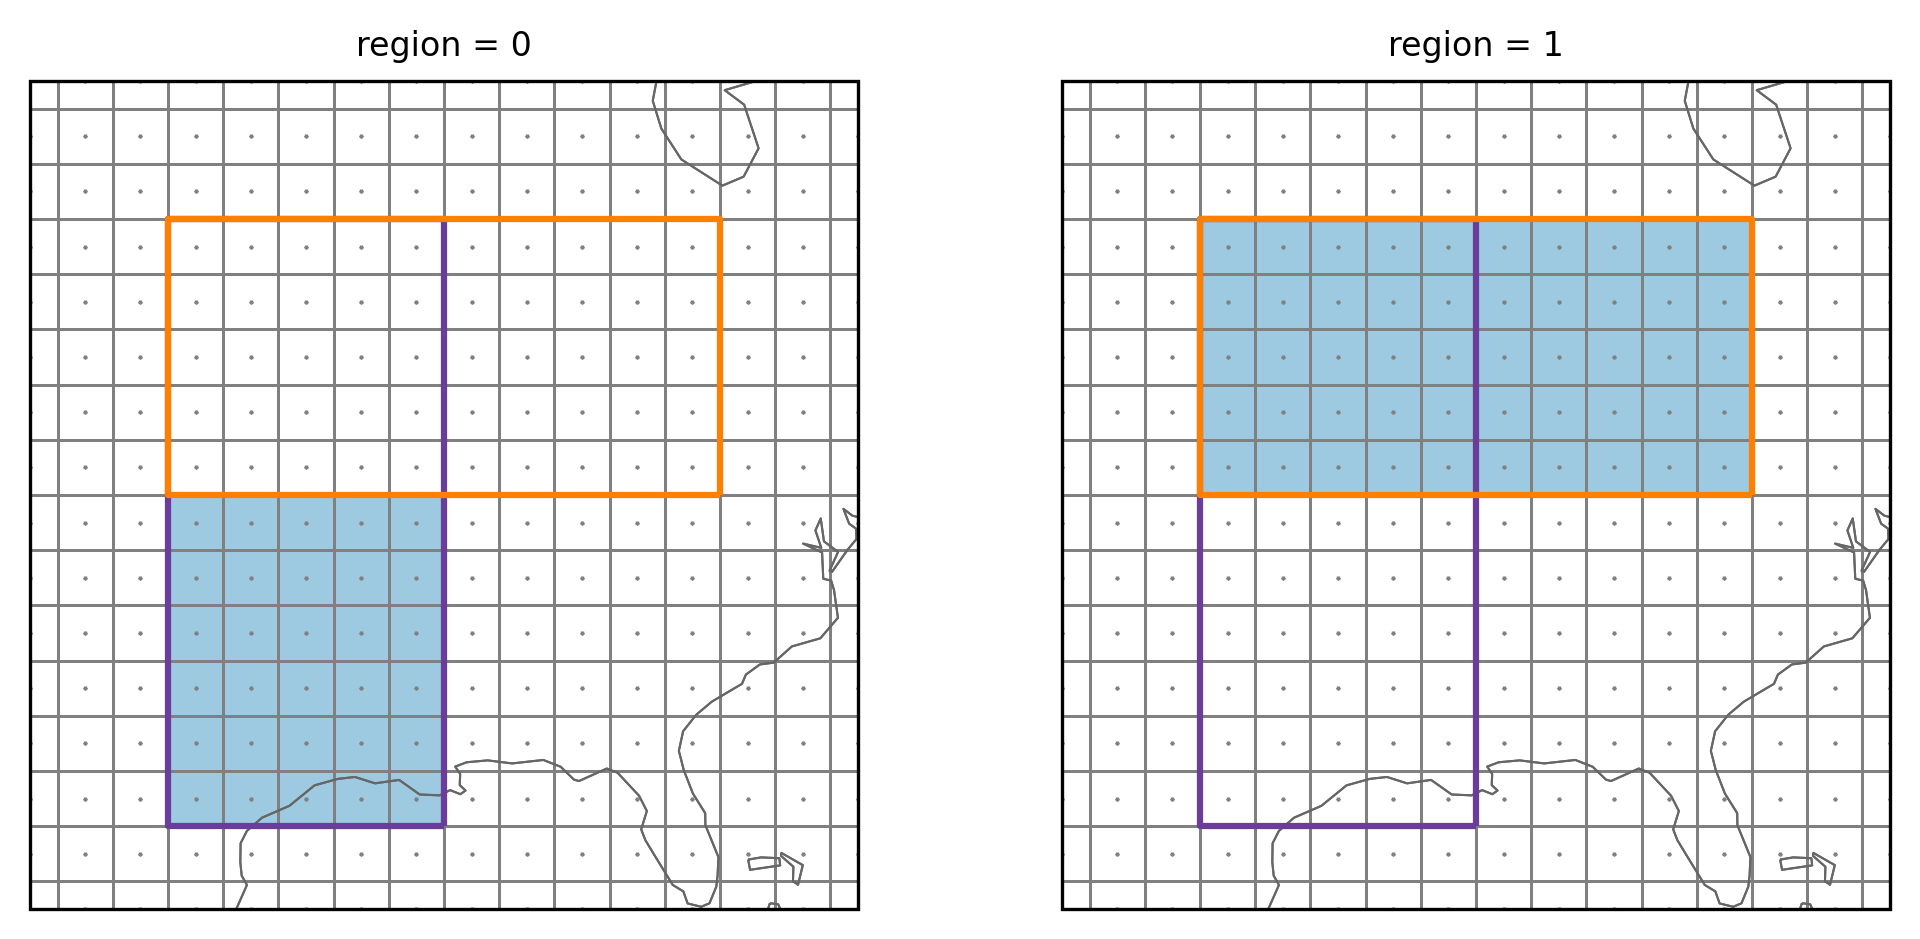
plot_region_vh(mask_vh, region_vh)

The small gray points show the gridpoint center and the vertical and horizontal lines are the gridpoint boundaries. The colored rectangles are the two regions. Here regionmask detects that certain gridpoints belong to two regions and correctly assigns them.
Setting overlap=False
We test what happens for overlap=False:
region_vh_overlap_false = regionmask.Regions([coords_v, coords_h], overlap=False)
Create a mask
mask_vh_overlap_false = region_vh_overlap_false.mask_3D(ds_US)
Plot the masked regions:
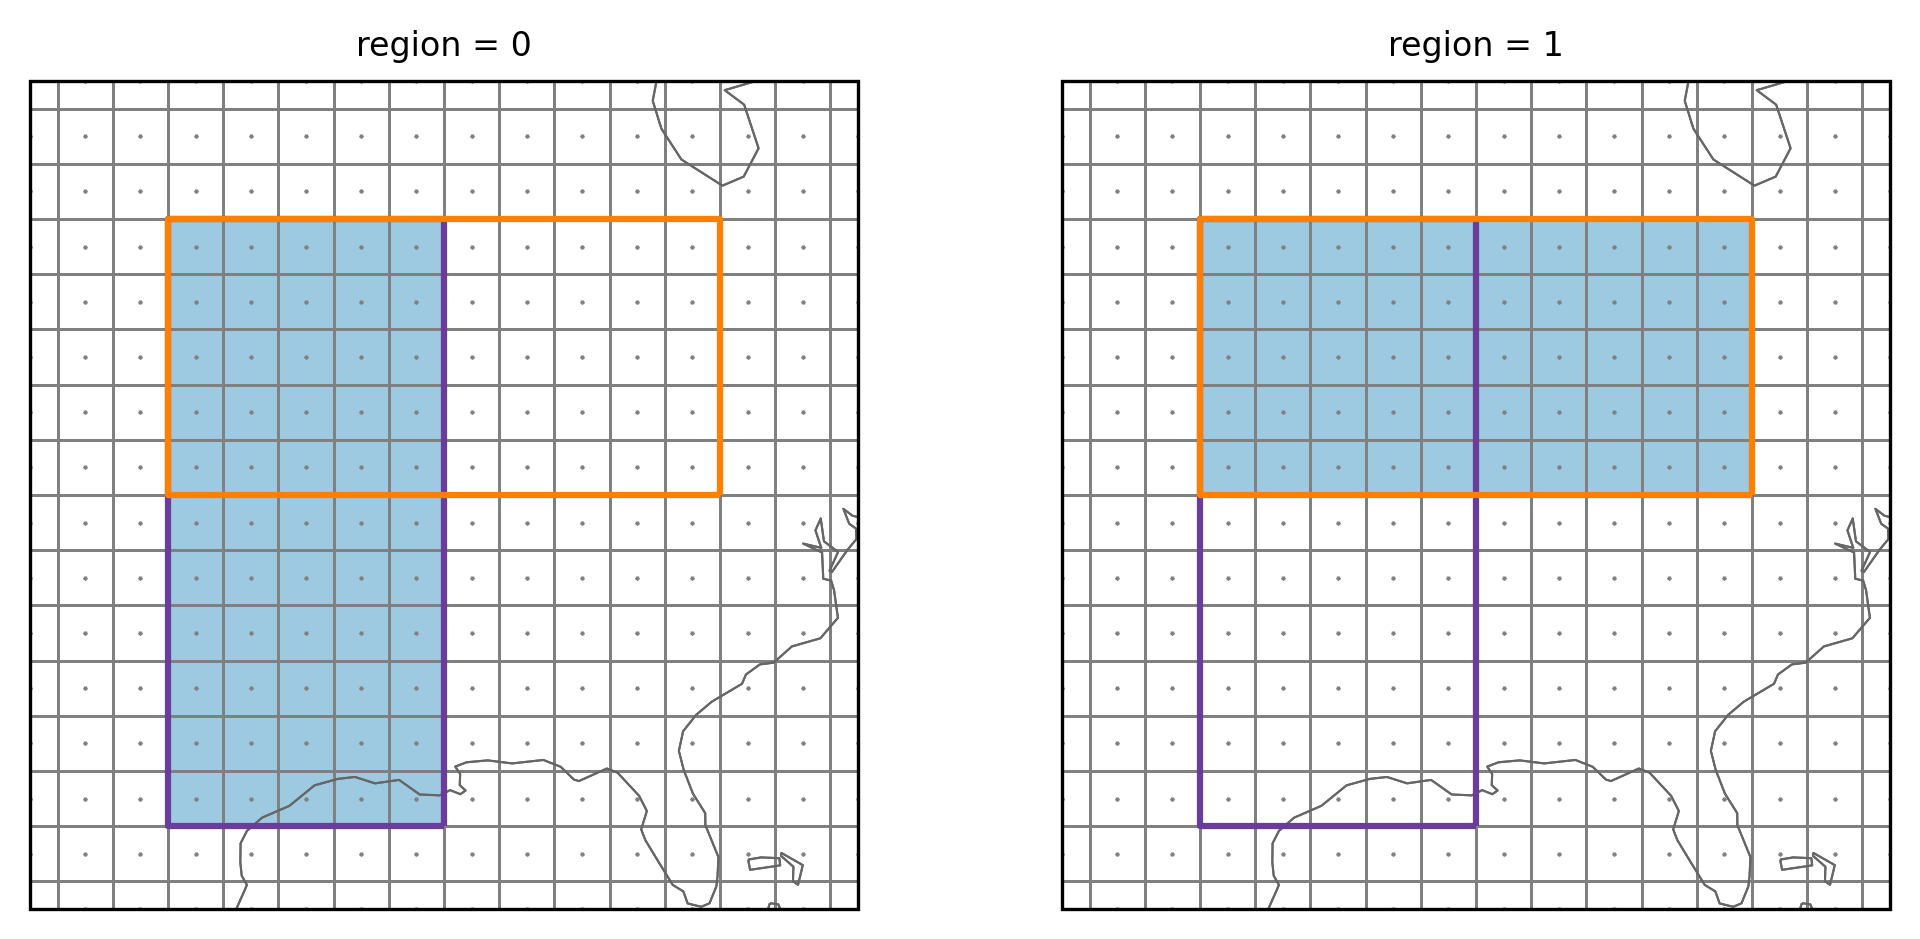
plot_region_vh(mask_vh_overlap_false, region_vh_overlap_false)
We can see that only the gridpoints in the lower part of the vertical (magenta) region were assigned to it. All gridpoints of the overlapping part are now assigned to the horizontal (orange) region - the gridpoints are assigned to the region with the higher number. By switching the order of the regions you could have the common gridpoints assigned to the vertical region.
Setting overlap=True
Passing overlap=True has the same effect as the default:
region_overlap = regionmask.Regions([coords_v, coords_h], overlap=True)

region_overlap
<regionmask.Regions 'unnamed'>
overlap:  True

Regions:
0 r0 Region0
1 r1 Region1

[2 regions]
Now it says overlap: True - and we can again create a mask:
mask_overlap = region_overlap.mask_3D(ds_US)
and plot it
plot_region_vh(mask_overlap, region_vh)
And the gridpoints in the overlapping part are assigned to both regions.
PRUDENCE regions
The PRUDENCE regions are a real-world example of overlapping areas. The
prudence regions already set overlap=True.
prudence = regionmask.defined_regions.prudence
prudence
<regionmask.Regions 'PRUDENCE'>
Source:   Christensen and Christensen, 2007, Climatic Change 81:7-30 (https:/...
overlap:  True

Regions:
1 BI     British Isles
2 IP Iberian Peninsula
3 FR            France
4 ME        Mid-Europe
5 SC       Scandinavia
6 AL              Alps
7 MD     Mediterranean
8 EA    Eastern Europe

[8 regions]
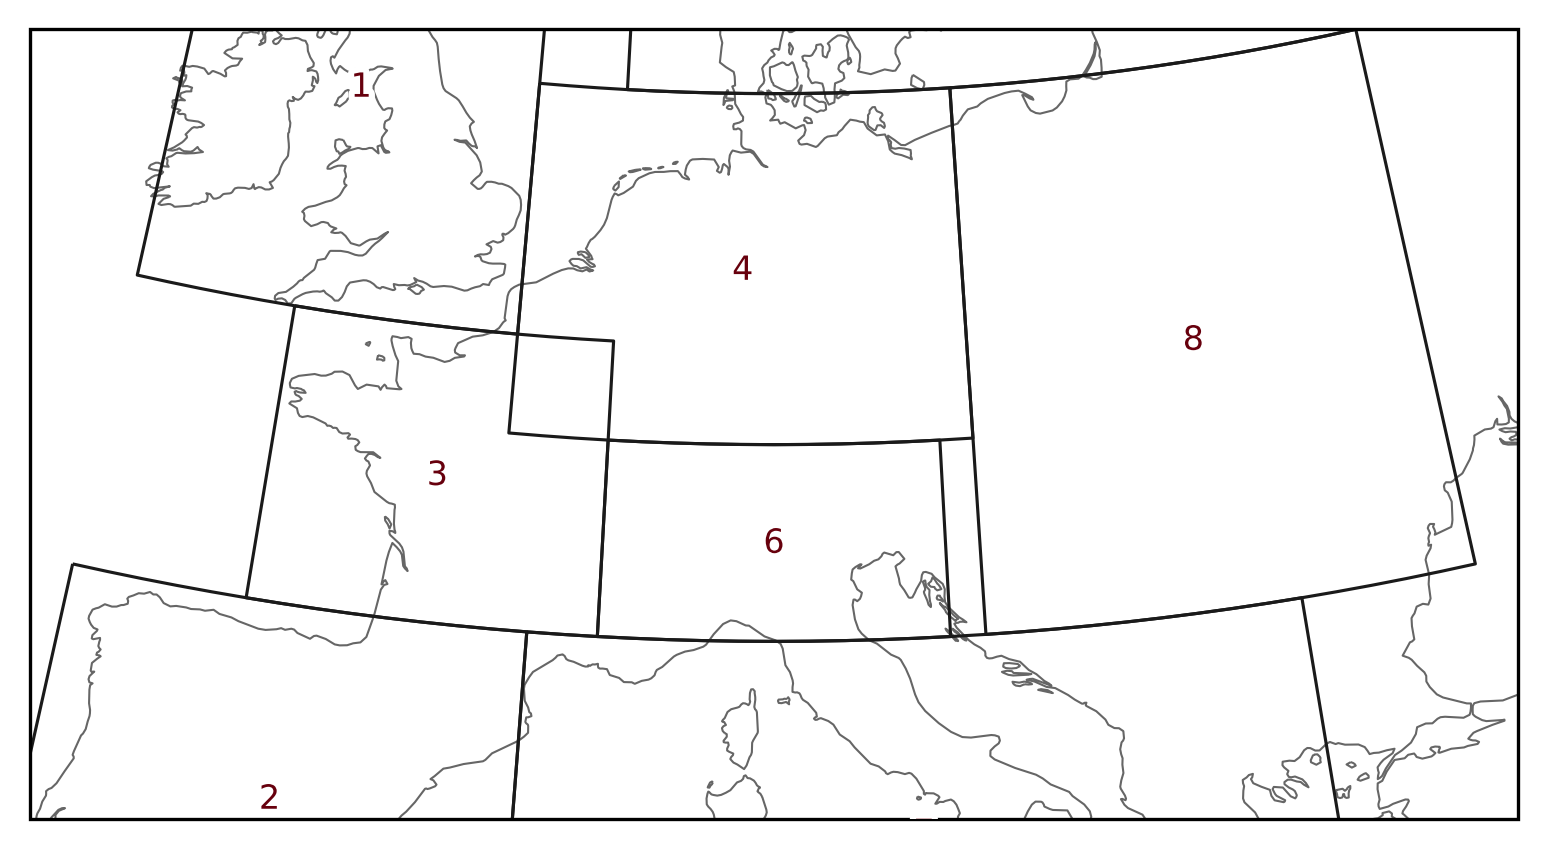
Regions 3 and 4 overlap in Western France:
proj = ccrs.LambertConformal(central_longitude=10)

text_kws = dict(
    bbox=dict(color="none"),
    path_effects=[pe.withStroke(linewidth=3, foreground="w")],
    color="#67000d",
)

ax = prudence.plot(
    projection=proj, text_kws=text_kws, resolution="50m", line_kws=dict(lw=0.75)
)


ax.set_extent([-10.0, 30.0, 40.0, 55.0], ccrs.PlateCarree())
Create mask of PRUDENCE regions
lon = np.arange(-12, 33, 0.25)
lat = np.arange(72, 33, -0.25)

mask_prudence = prudence.mask_3D(lon, lat)
proj = ccrs.LambertConformal(central_longitude=10)

fg = mask_prudence.sel(region=[3, 4]).plot(
    subplot_kws=dict(projection=proj),
    col="region",
    cmap=cmap,
    add_colorbar=False,
    transform=ccrs.PlateCarree(),
)


for ax in fg.axs.flatten():
    regionmask.defined_regions.prudence.plot(
        ax=ax, add_label=False, resolution="50m", line_kws=dict(lw=0.75)
    )
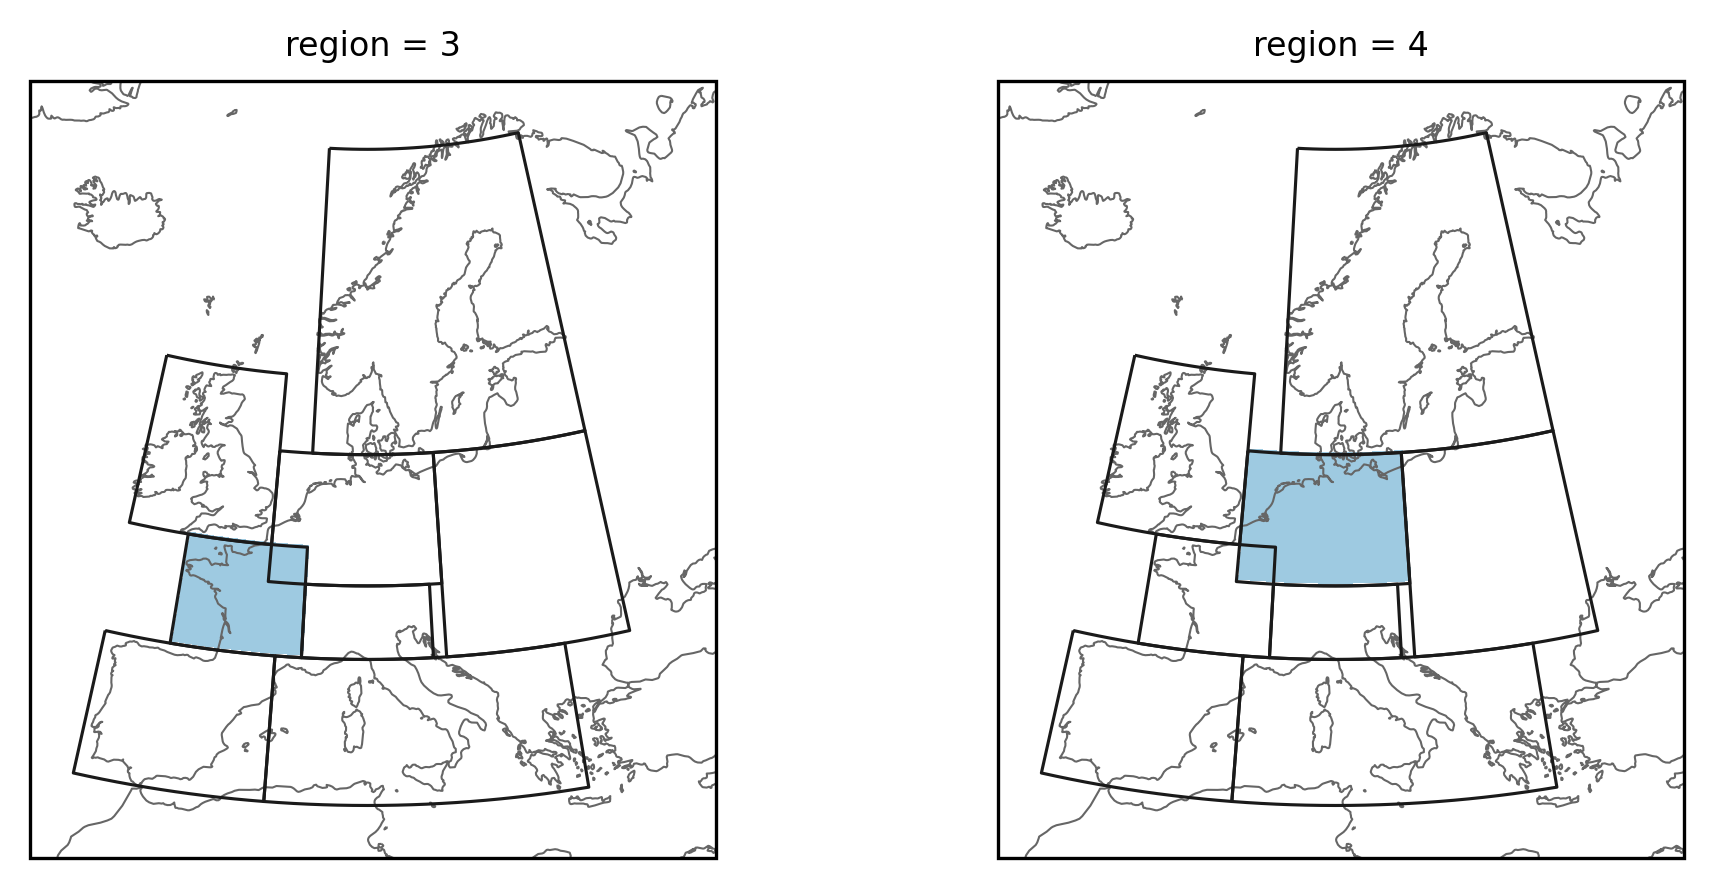
As above the gridpoints below the overlapping part is now assigned to both regions.