None
Note
This tutorial was generated from an IPython notebook that can be accessed from github.
Plotting
Every region has two plotting functions, which draw the outlines of all regions:
plot: draws the region polygons on a cartopy GeoAxes (map)plot_regions: draws the the region polygons only
Import regionmask and check the version:
import regionmask

regionmask.__version__
'0.12.1.post1.dev10+g9fd2ed6'
We use the srex regions to illustrate the plotting:
srex = regionmask.defined_regions.srex
srex
<regionmask.Regions 'SREX'>
Source:   Seneviratne et al., 2012 (https://www.ipcc.ch/site/assets/uploads/2...
overlap:  False

Regions:
 1 ALA       Alaska/N.W. Canada
 2 CGI     Canada/Greenl./Icel.
 3 WNA         W. North America
 4 CNA         C. North America
 5 ENA         E. North America
..  ..                      ...
22 EAS                  E. Asia
23 SAS                  S. Asia
24 SEA                S.E. Asia
25 NAU             N. Australia
26 SAU S. Australia/New Zealand

[26 regions]
Plot all regions
Calling plot() on any region without any arguments draws the default
map with a PlateCarree() projection and includes the coastlines:
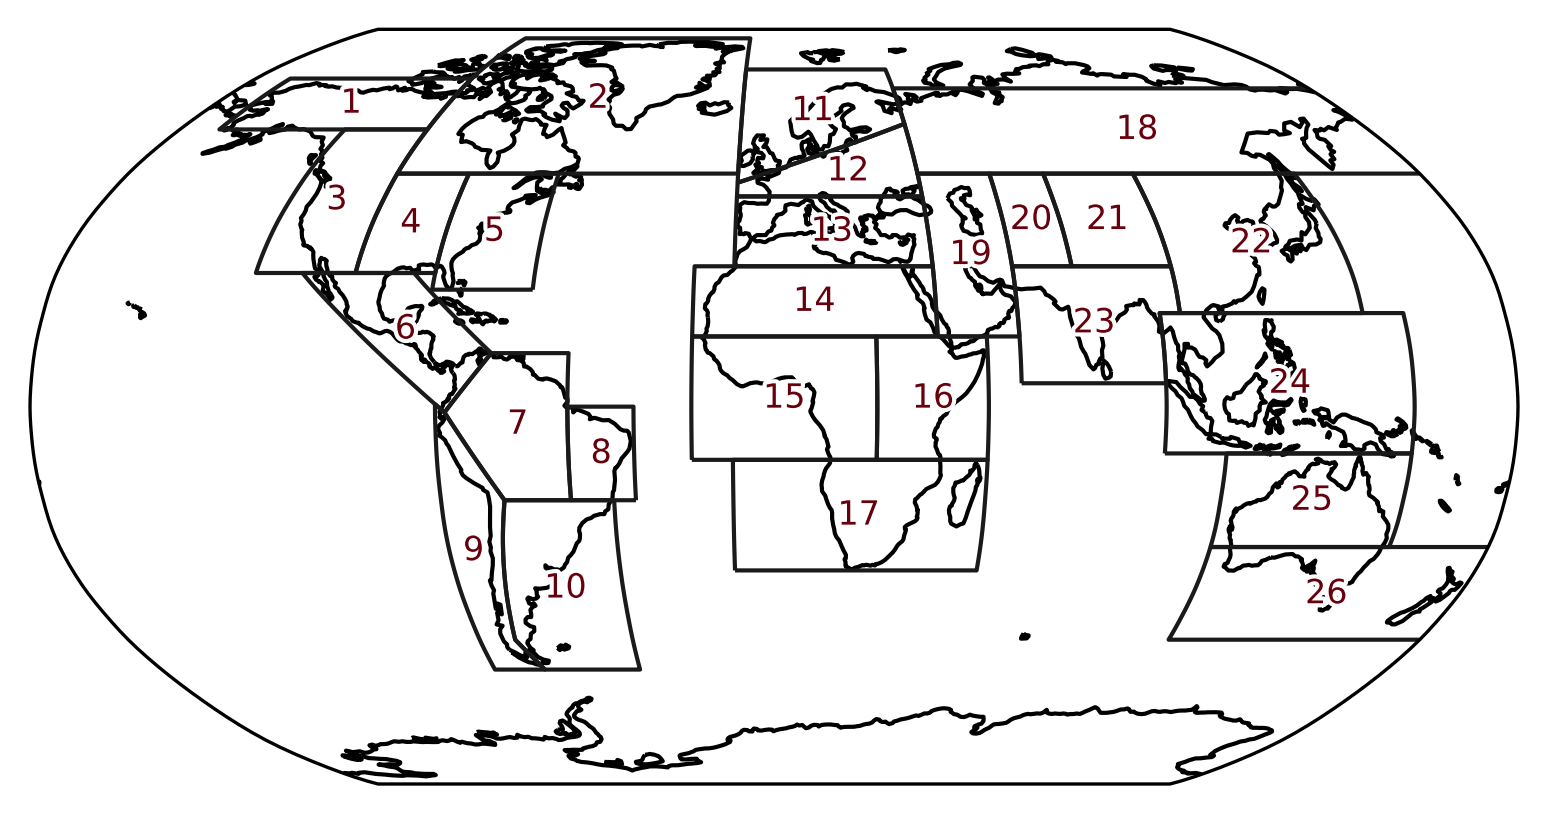
srex.plot();
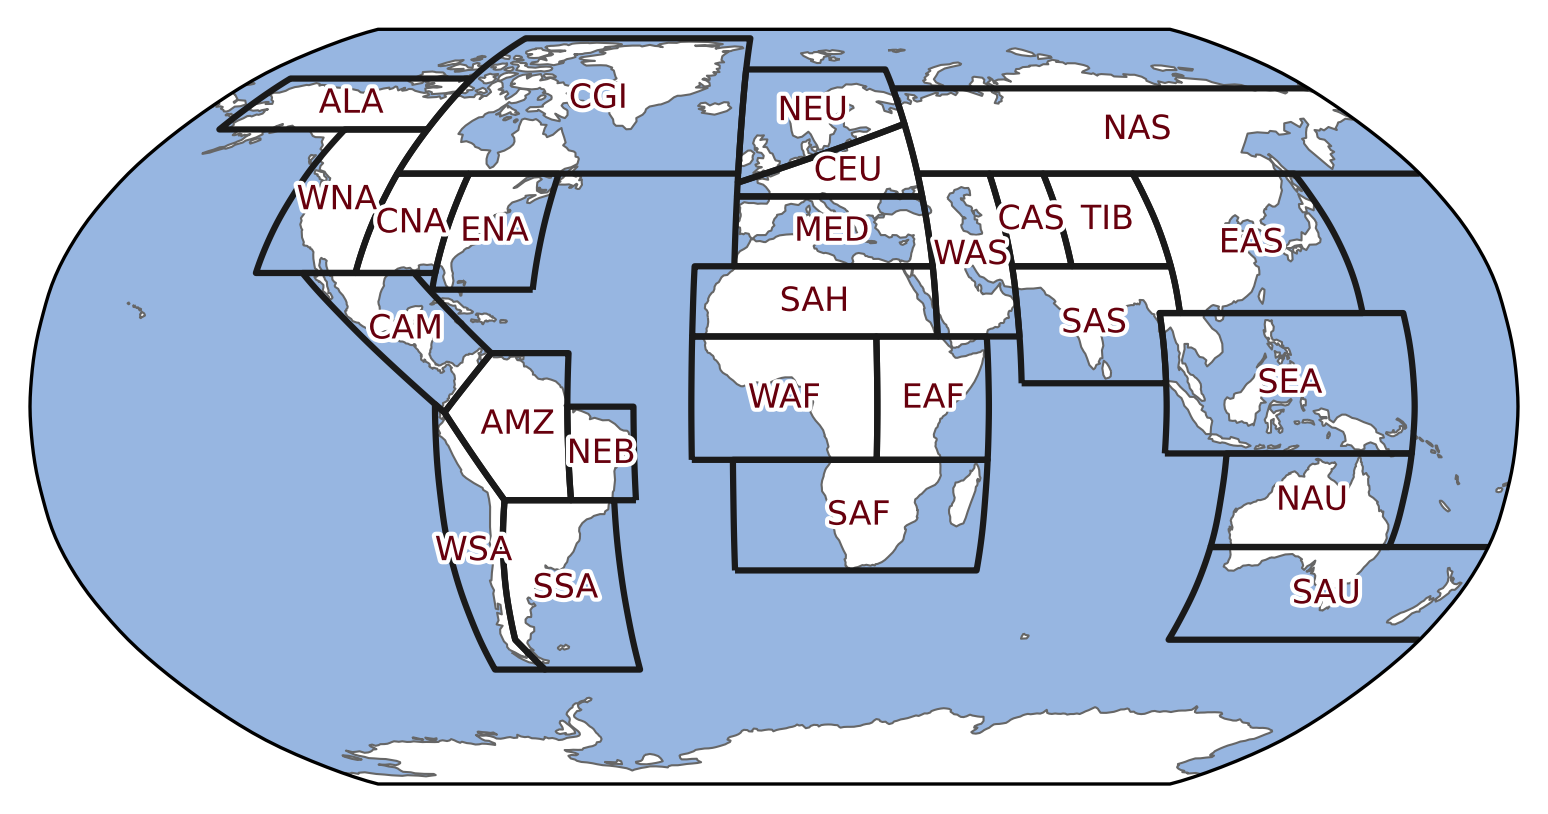
Plot options
The plot method has a large number of arguments to adjust the layout
of the axes. For example, you can pass a custom projection, the labels
can display the abbreviation instead of the region number, the ocean can
be colored, etc.. This example also shows how to use
matplotlib.patheffects to ensure the labels are easily readable
without covering too much of the map (compare to the map above):
import cartopy.crs as ccrs
import matplotlib.patheffects as pe

text_kws = dict(
    bbox=dict(color="none"),
    path_effects=[pe.withStroke(linewidth=2, foreground="w")],
    color="#67000d",
    fontsize=8,
)

ax = srex.plot(
    projection=ccrs.Robinson(), label="abbrev", add_ocean=True, text_kws=text_kws
)

ax.set_global()
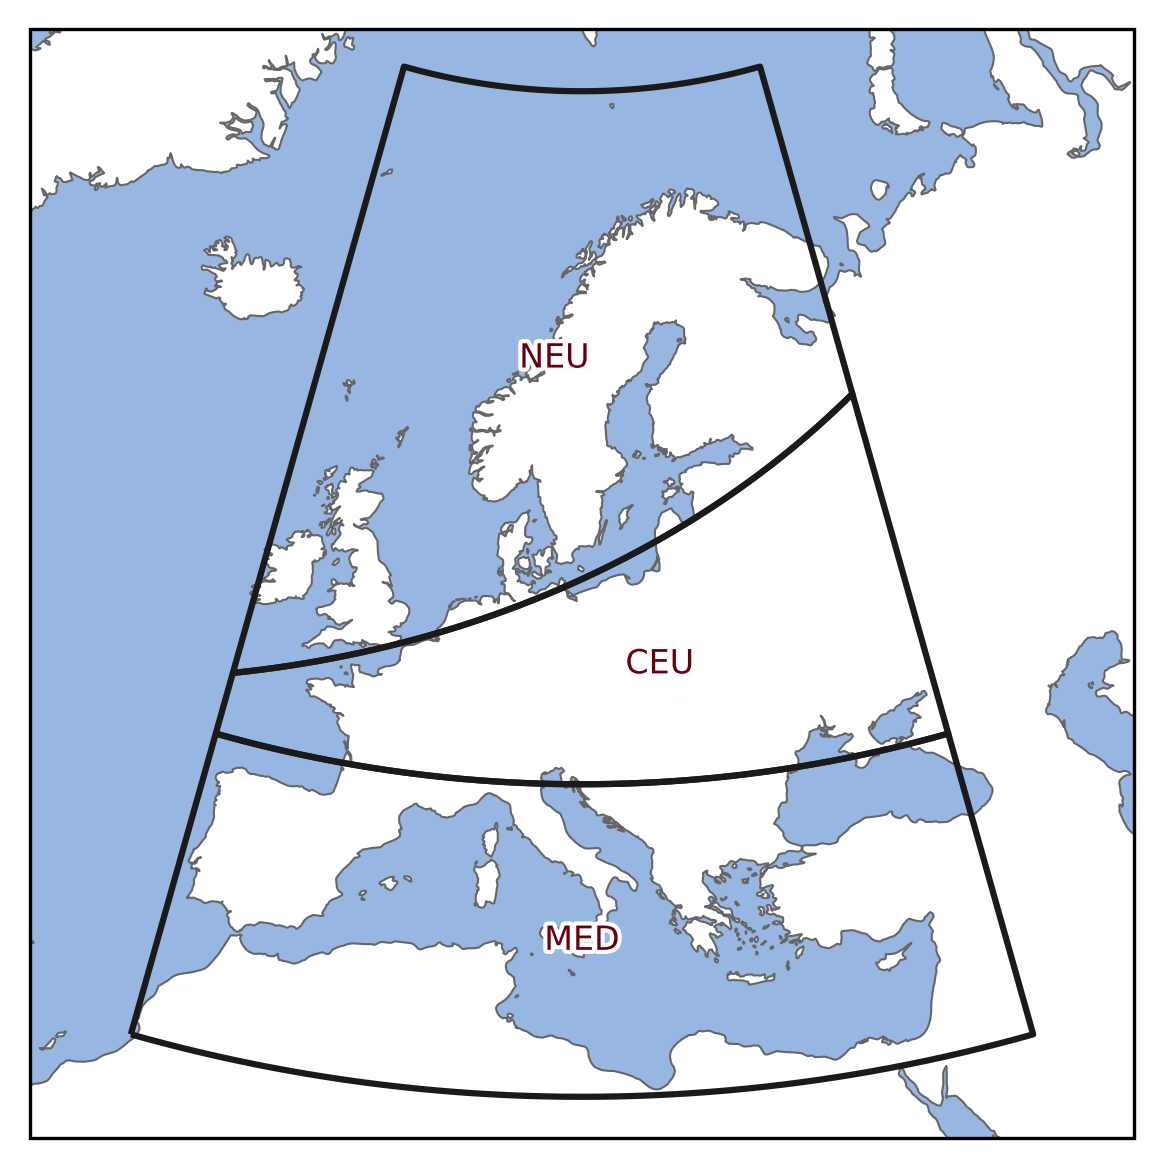
Plot only a Subset of Regions
To plot a selection of regions subset them using indexing:
# regions can be selected by number, abbreviation or long name
regions = [11, "CEU", "S. Europe/Mediterranean"]

# choose a good projection for regional maps
projection = ccrs.LambertConformal(central_longitude=15)

ax = srex[regions].plot(
    add_ocean=True,
    resolution="50m",
    projection=projection,
    label="abbrev",
    text_kws=text_kws,
)

# fine tune the extent
ax.set_extent([-15, 45, 28, 76], crs=ccrs.PlateCarree())
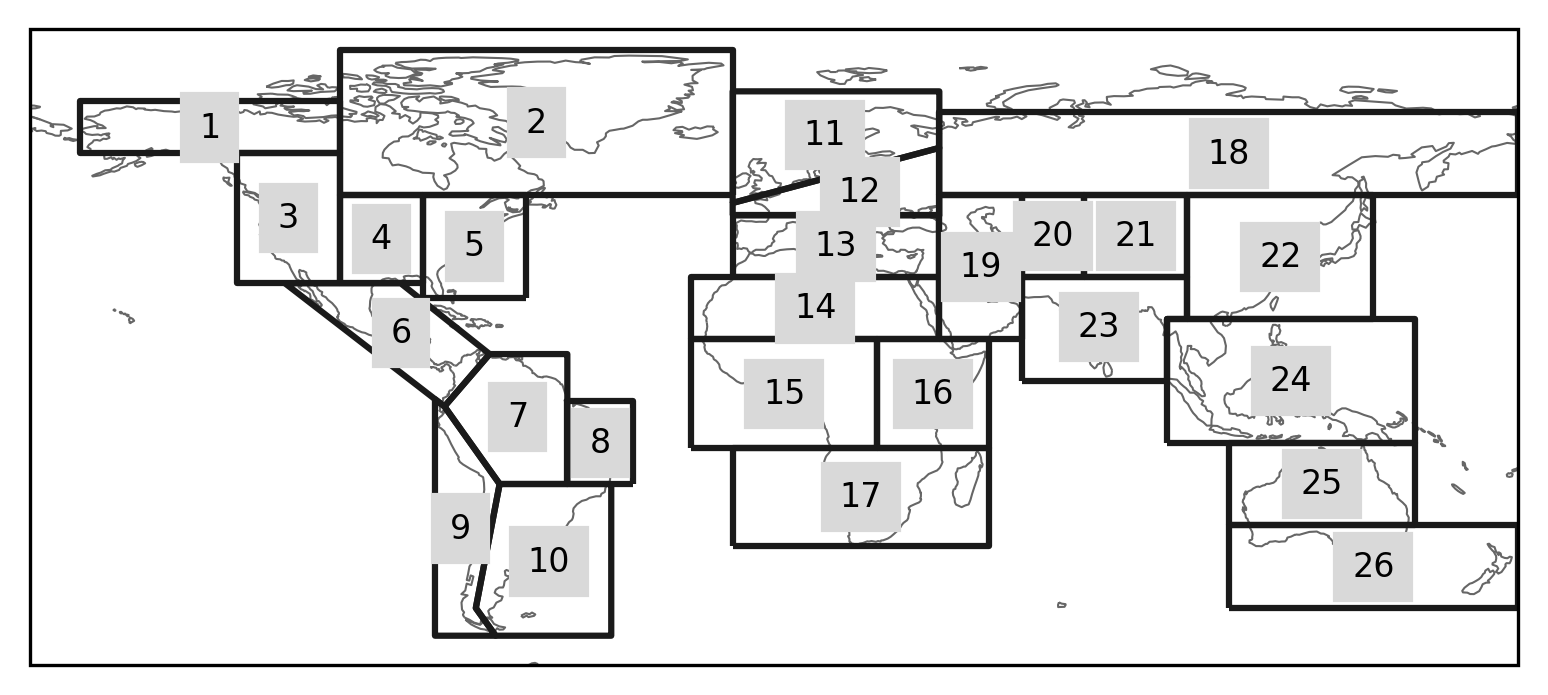
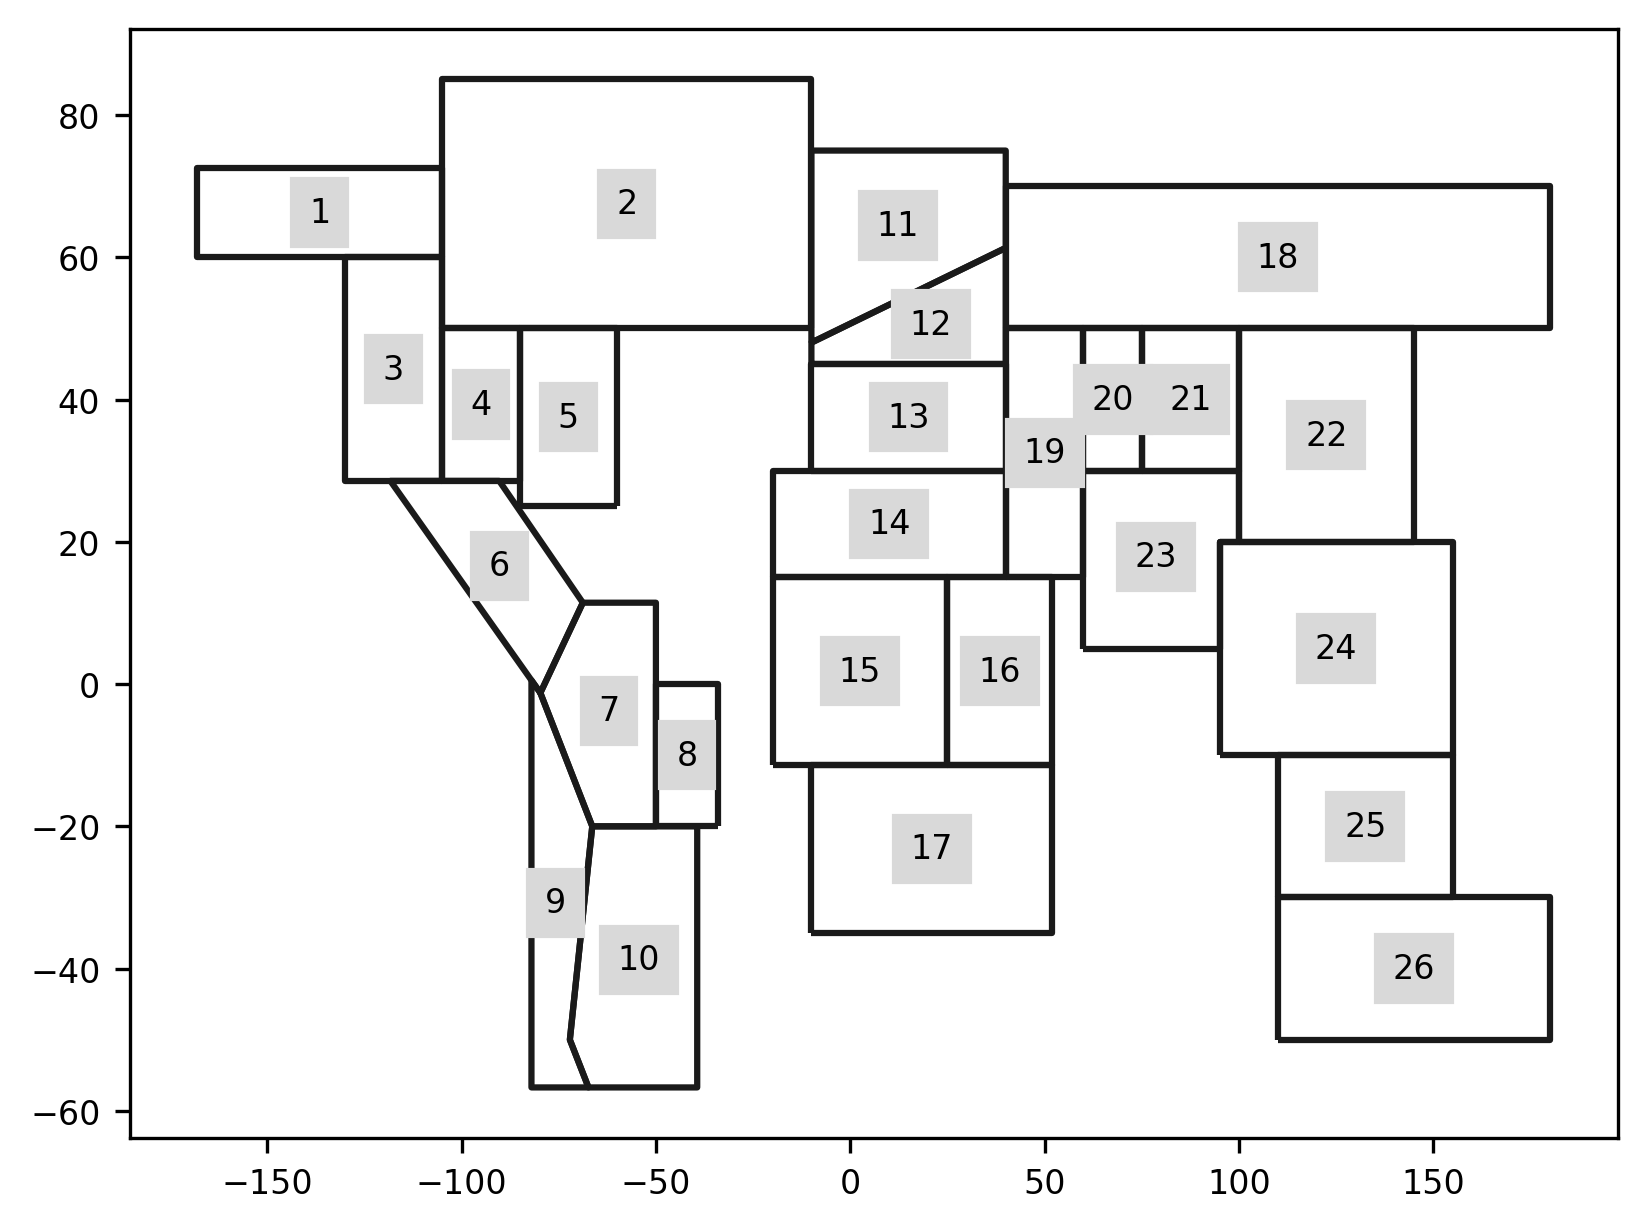
Plotting the region polygons only (no map)
srex.plot_regions();
Note
This does not create a cartopy GeoAxes.
To achieve this, you need to explicitly create the axes:
import matplotlib.pyplot as plt

f, ax = plt.subplots(subplot_kw=dict(projection=ccrs.Robinson()))

srex.plot_regions(ax=ax, line_kws=dict(lw=1), text_kws=text_kws)

ax.coastlines()
ax.set_global()