None
Note
This tutorial was generated from an IPython notebook that can be accessed from github.
Overlapping regions
Two or more on regions can share the same area - they overlap, as for example region 3 and 4 of the PRUDENCE regions This notebook illustrates how overlapping regions can be treated in regionmask.
In short
Warning
Per default regionmask assumes regions are not overlapping!
Thus, when creating your own Regions you need to tell regionmask if
they are overlapping.
region = regionmask.Regions(..., overlap=True)
region = regionmask.from_geopandas(..., overlap=True)
If you have two overlapping regions and overlap=False regionmask
will silently assign the gridpoints of the overlapping regions to the
one with the higher number, e.g., region 4 for PRUDENCE (this may change
in a future version).
Note that overlap is correctly defined in
regionmask.defined_regions.
Example
To illustrate the problem we construct two regions in North America that partially overlap. One is horizontal, the other vertical.
Preparation
Import regionmask and check the version:
import regionmask

regionmask.__version__
'0.10.0'
Other imports
import xarray as xr
import numpy as np

import cartopy.crs as ccrs
import matplotlib.pyplot as plt

from matplotlib import colors as mplc
from shapely.geometry import Polygon

import matplotlib.patheffects as pe
Define some colors:
cmap = mplc.ListedColormap(["none", "#9ecae1"])
Define helper function:
def plot_region_vh(mask):

    fg = mask.plot(
        subplot_kws=dict(projection=ccrs.PlateCarree()),
        col="region",
        cmap=cmap,
        add_colorbar=False,
        transform=ccrs.PlateCarree(),
        ec="0.5",
        lw=0.25,
    )

    for ax in fg.axes.flatten():
        region_vh[[0]].plot(ax=ax, add_label=False, line_kws=dict(color="#6a3d9a"))
        region_vh[[1]].plot(ax=ax, add_label=False, line_kws=dict(color="#ff7f00"))

        ax.set_extent([-105, -75, 25, 55], ccrs.PlateCarree())
        ax.plot(
            ds_US.LON, ds_US.lat, "*", color="0.5", ms=0.5, transform=ccrs.PlateCarree()
        )
Define the polygons:
coords_v = np.array([[-90.0, 50.0], [-90.0, 28.0], [-100.0, 28.0], [-100.0, 50.0]])
coords_h = np.array([[-80.0, 50.0], [-80.0, 40.0], [-100.0, 40.0], [-100.0, 50.0]])
Default behavior (overlap=False)
Fe first test what happens if we keep the default value of
overlap=False:
region_vh = regionmask.Regions([coords_v, coords_h])
Create a mask
ds_US = regionmask.core.utils.create_lon_lat_dataarray_from_bounds(
    *(-160, -29, 2), *(76, 13, -2)
)

mask_vh = region_vh.mask_3D(ds_US)
Plot the masked regions:
plot_region_vh(mask_vh)
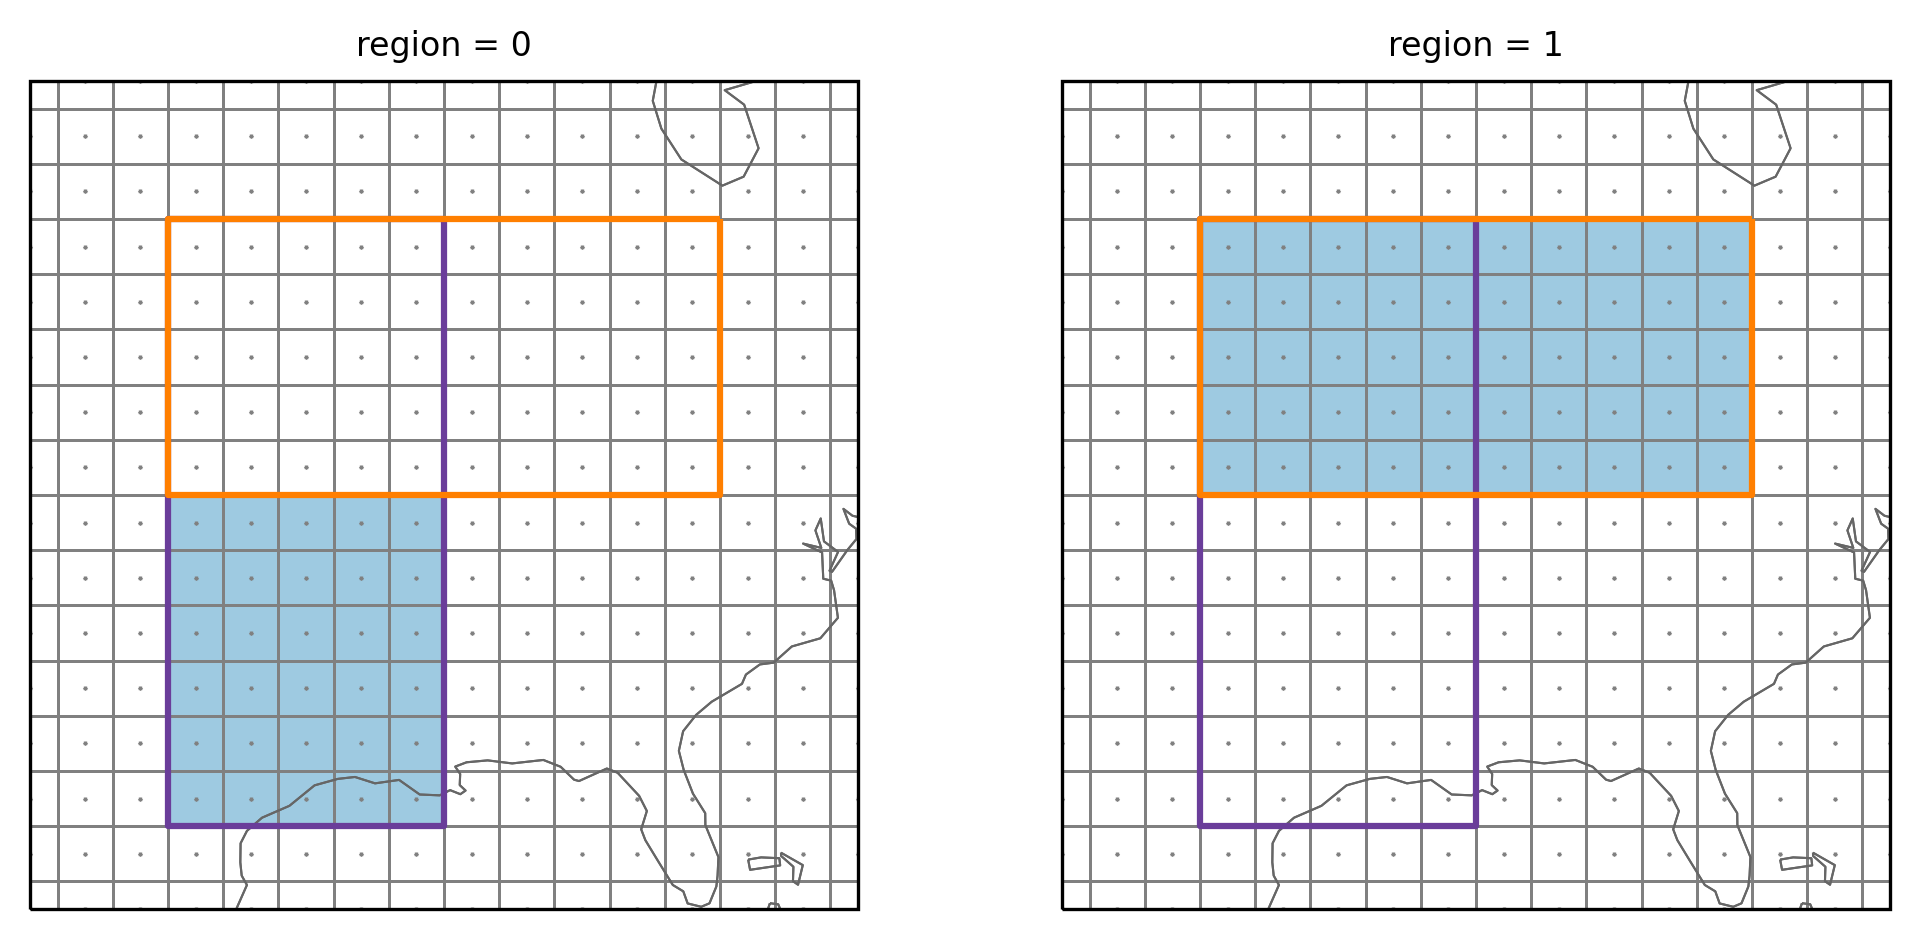
The small gray points show the gridpoint center and the vertical and horizontal lines are the gridpoint boundaries. The colored rectangles are the two regions. The vertical region has the number 1 and the horizontal region the number 2. We can see that only the gridpoints in the lower part of the vertical (magenta) region were assigned to it. All gridpoints of the overlapping part are now assigned to the horizontal (orange) region. As mentioned the gridpoints are assigned to the region with the higher number By switching the order of the regions you could have the common gridpoints assigned to the vertical region.
Setting overlap=True
As mentioned regionmask assumes regions are not overlapping, so you need
to pass overlap=True to the constructor:
region_overlap = regionmask.Regions([coords_v, coords_h], overlap=True)

region_overlap
<regionmask.Regions 'unnamed'>
overlap:  True

Regions:
0 r0 Region0
1 r1 Region1

[2 regions]
Now it says overlap: True - and we can again create a mask:
mask_overlap = region_overlap.mask_3D(ds_US)
and plot it
plot_region_vh(mask_overlap)
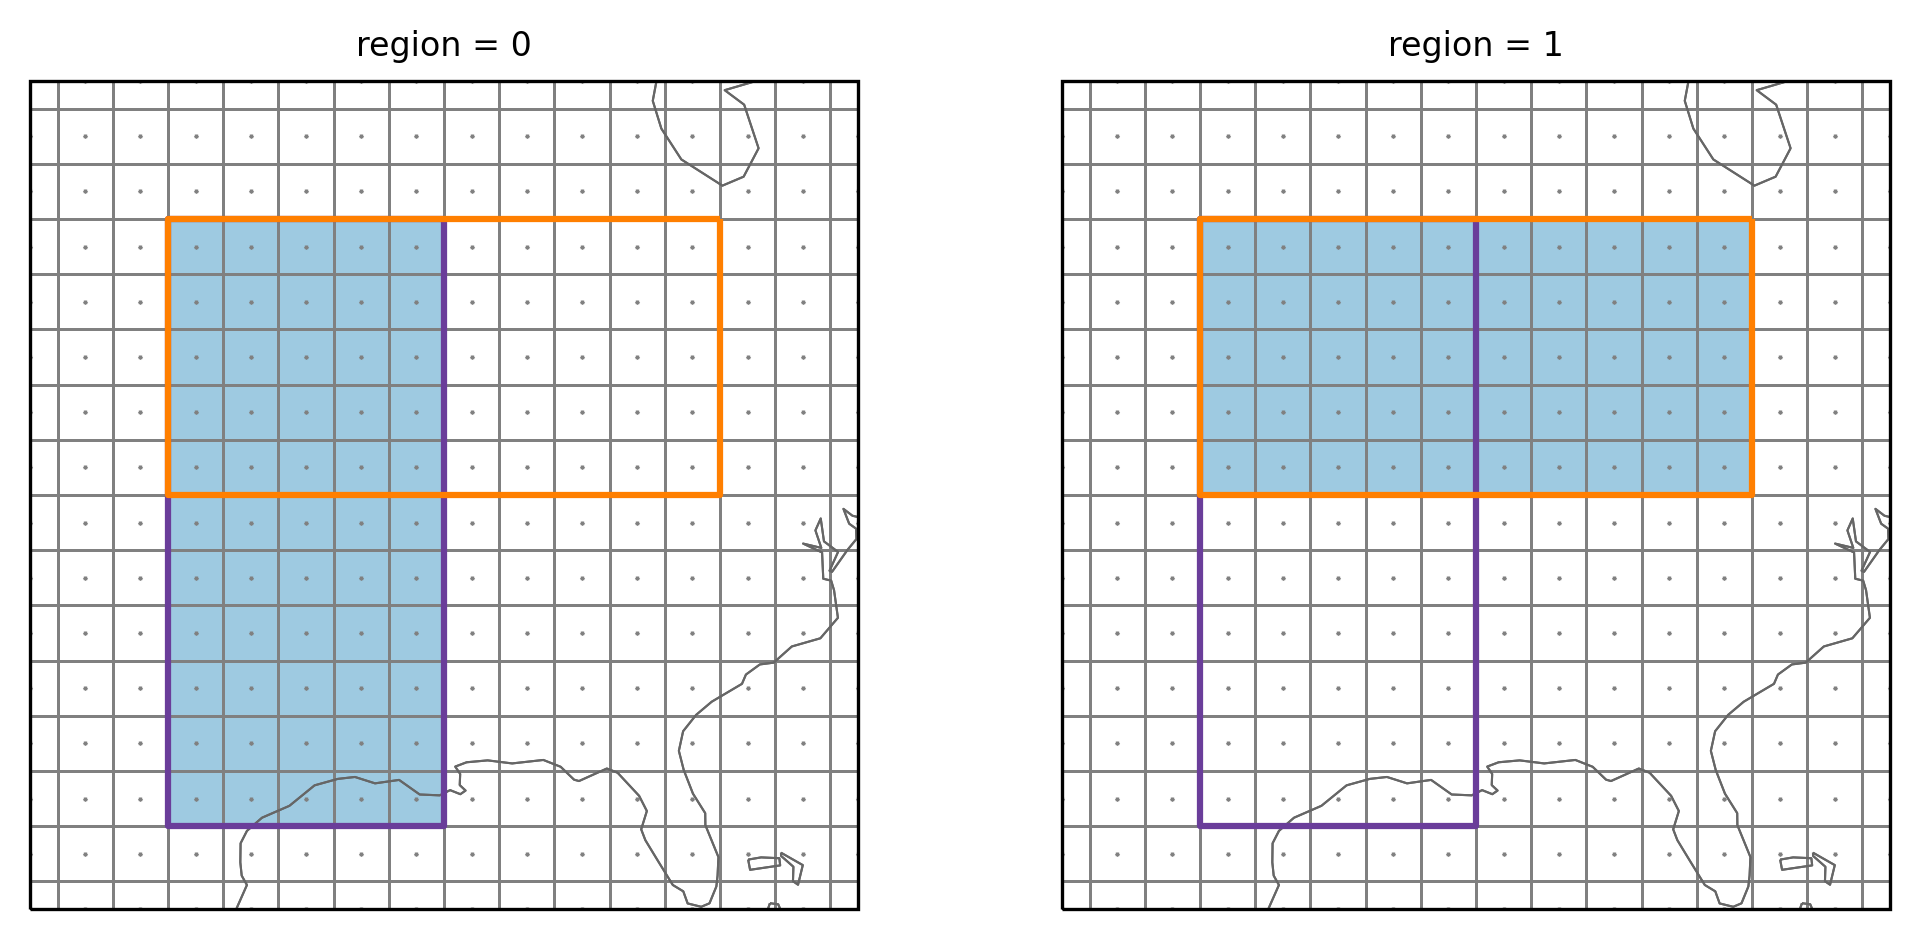
Now the gridpoints in the overlapping part are assigned to both regions.
PRUDENCE regions
The PRUDENCE regions are a real-world example of overlapping areas. The
prudence regions already set overlap=True.
prudence = regionmask.defined_regions.prudence
prudence
<regionmask.Regions 'PRUDENCE'>
Source:   Christensen and Christensen, 2007, Climatic Change 81:7-30 (https:/...
overlap:  True

Regions:
1 BI     British Isles
2 IP Iberian Peninsula
3 FR            France
4 ME        Mid-Europe
5 SC       Scandinavia
6 AL              Alps
7 MD     Mediterranean
8 EA    Eastern Europe

[8 regions]
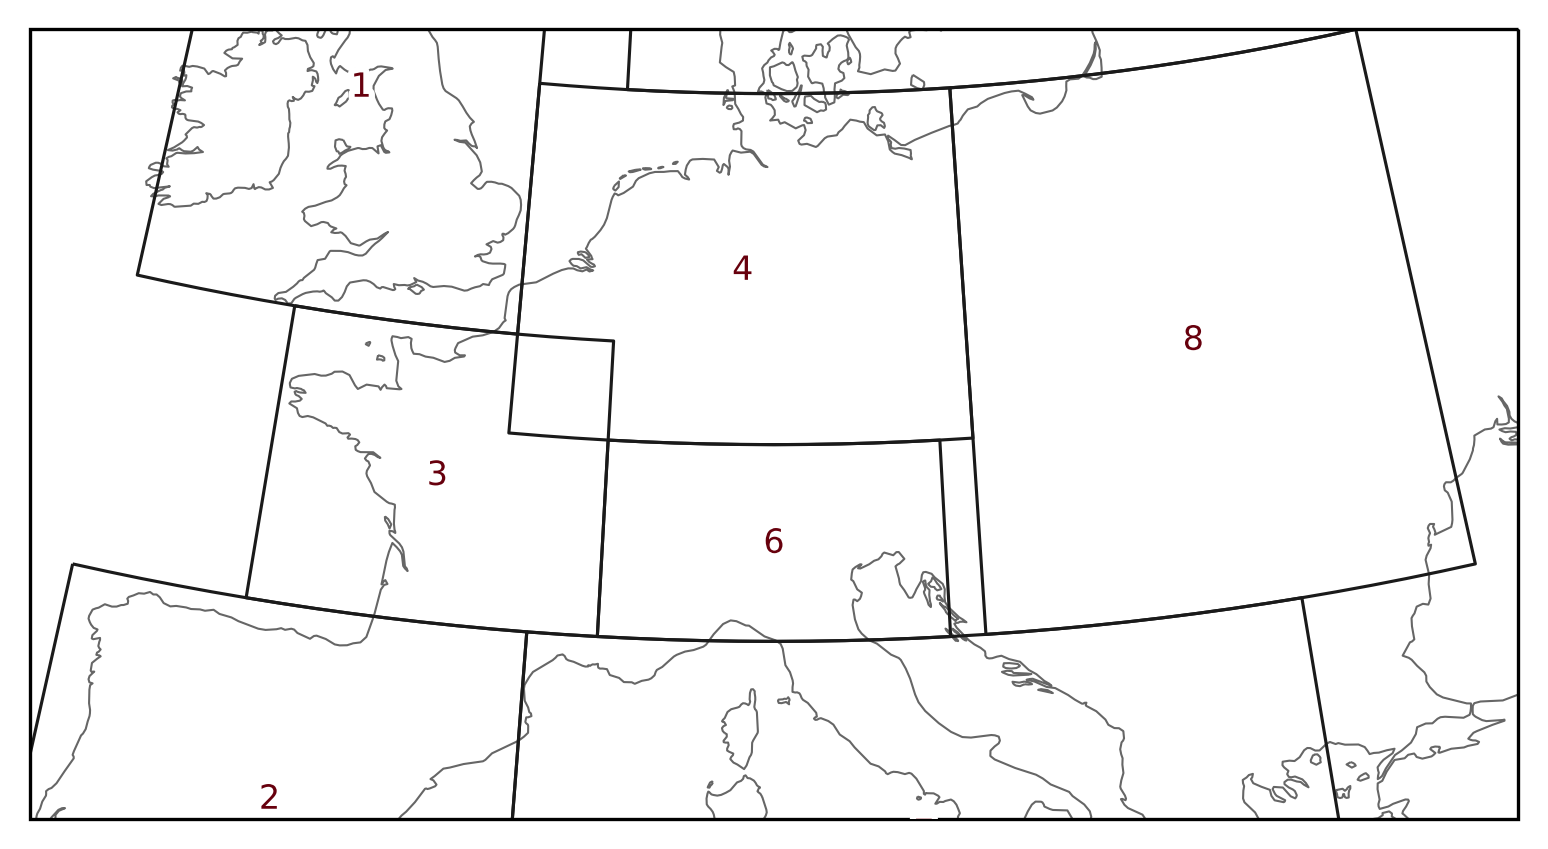
Regions 3 and 4 overlap in Western France:
proj = ccrs.LambertConformal(central_longitude=10)

text_kws = dict(
    bbox=dict(color="none"),
    path_effects=[pe.withStroke(linewidth=3, foreground="w")],
    color="#67000d",
)

ax = prudence.plot(
    projection=proj, text_kws=text_kws, resolution="50m", line_kws=dict(lw=0.75)
)


ax.set_extent([-10.0, 30.0, 40.0, 55.0], ccrs.PlateCarree())
Create mask of PRUDENCE regions
lon = np.arange(-12, 33, 0.5)
lat = np.arange(72, 33, -0.5)

mask_prudence = prudence.mask_3D(lon, lat)
proj = ccrs.LambertConformal(central_longitude=10)

fg = mask_prudence.sel(region=[3, 4]).plot(
    subplot_kws=dict(projection=proj),
    col="region",
    cmap=cmap,
    add_colorbar=False,
    transform=ccrs.PlateCarree(),
)


for ax in fg.axes.flatten():
    regionmask.defined_regions.prudence.plot(
        ax=ax, add_label=False, resolution="50m", line_kws=dict(lw=0.75)
    )
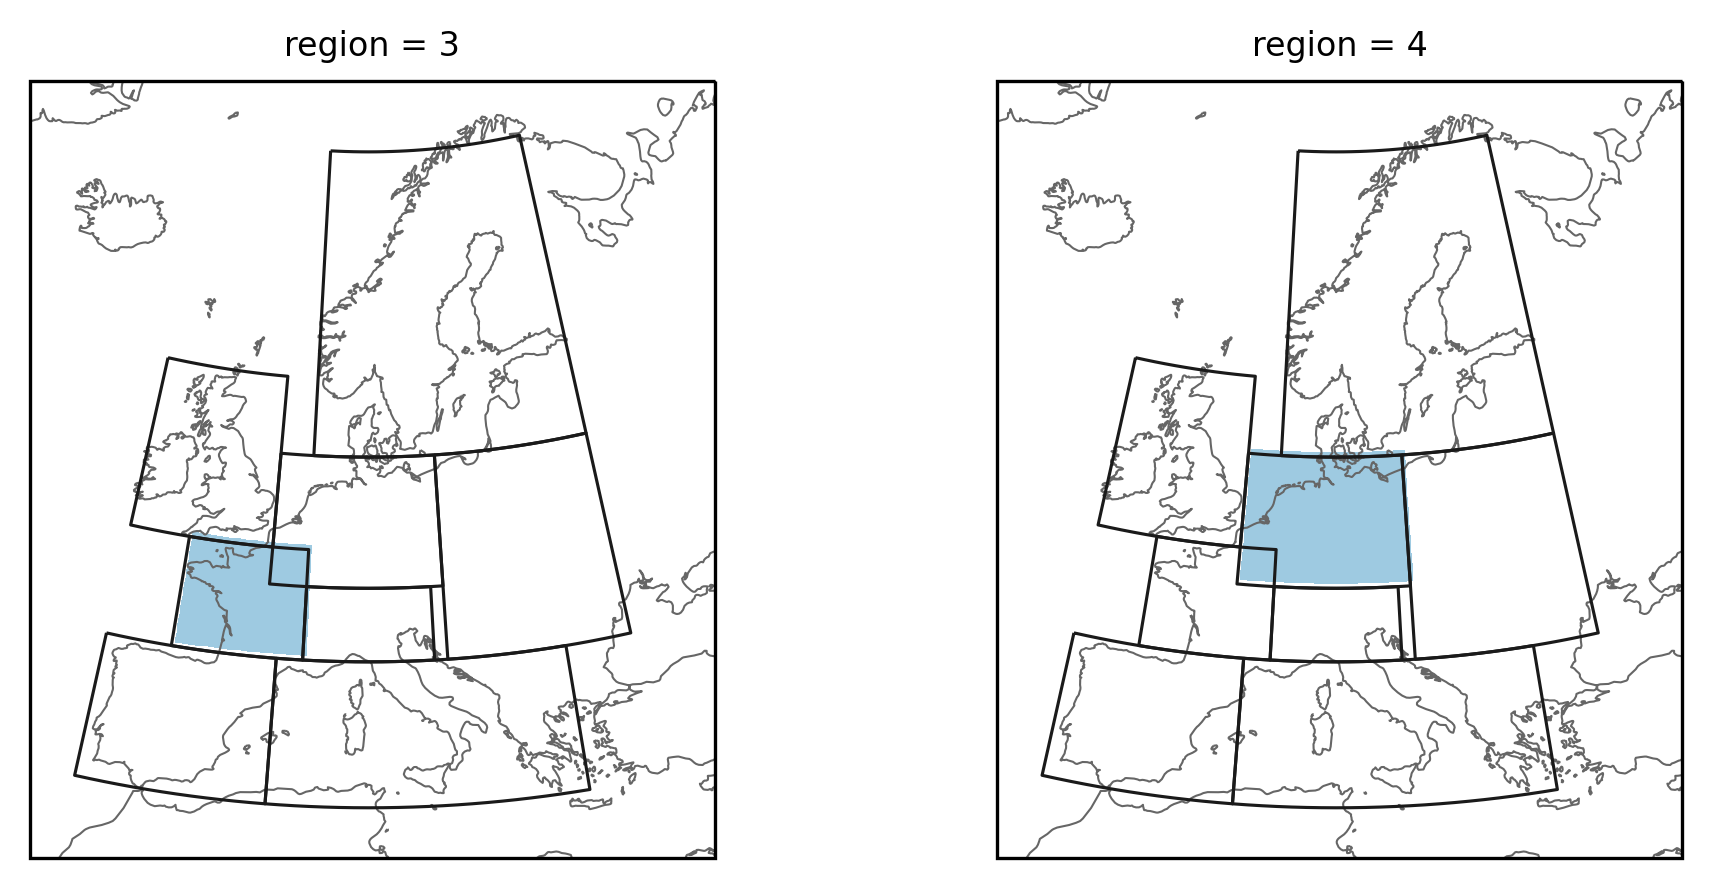
As above the gridpoints below the overlapping part is now assigned to both regions.