None
Note
This tutorial was generated from an IPython notebook that can be accessed from github.
Create your own region
Creating own regions is straightforward. Import regionmask and check the version:
import cartopy.crs as ccrs
import numpy as np
import matplotlib.pyplot as plt

import regionmask

regionmask.__version__
'0.10.0'
Import numpy
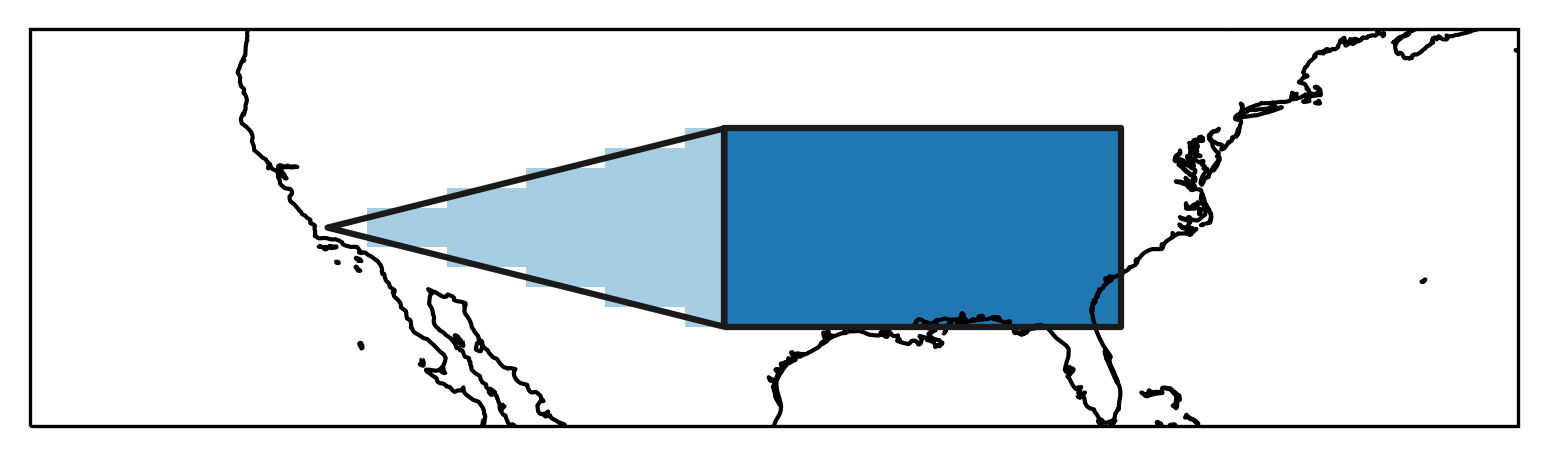
Assume you have two custom regions in the US, you can easily use these
to create Regions:
US1 = np.array([[-100.0, 30], [-100, 40], [-120, 35]])
US2 = np.array([[-100.0, 30], [-80, 30], [-80, 40], [-100, 40]])

regionmask.Regions([US1, US2])
<regionmask.Regions 'unnamed'>
overlap:  False

Regions:
0 r0 Region0
1 r1 Region1

[2 regions]
Note
Set overlap=True if some of the regions overlap. See the tutorial on overlapping regions for details.
If you want to set the names and abbrevs yourself you can still
do that:
names = ["US_west", "US_east"]
abbrevs = ["USw", "USe"]

USregions = regionmask.Regions([US1, US2], names=names, abbrevs=abbrevs, name="US")
USregions
<regionmask.Regions 'US'>
overlap:  False

Regions:
0 USw US_west
1 USe US_east

[2 regions]
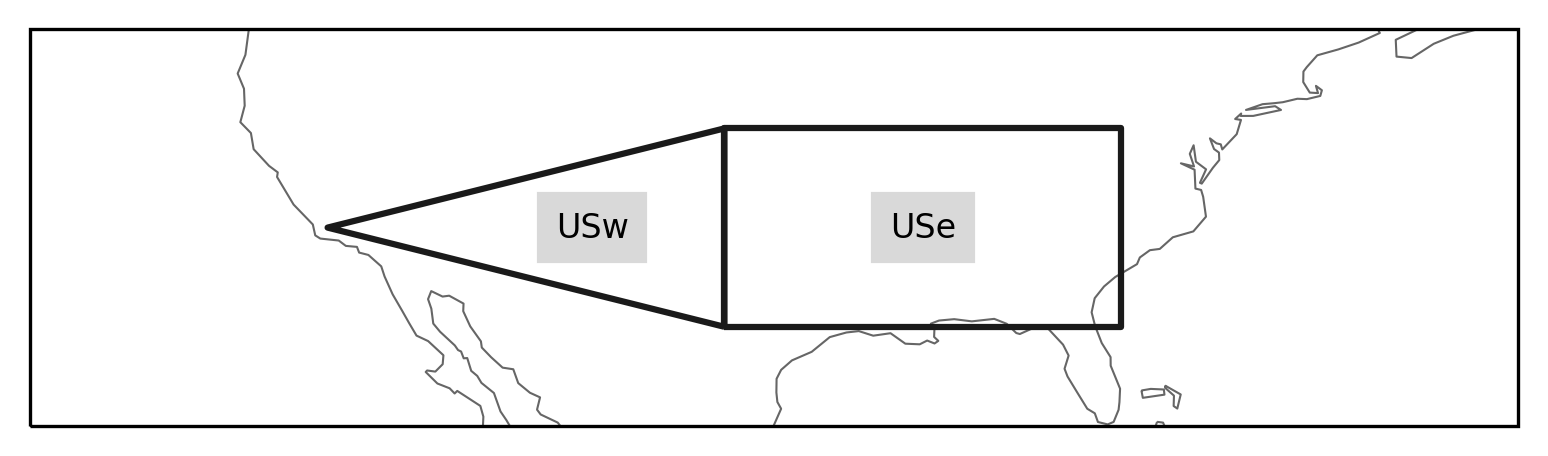
Again we can plot the outline of the defined regions
ax = USregions.plot(label="abbrev")

# fine tune the extent
ax.set_extent([225, 300, 25, 45], crs=ccrs.PlateCarree())
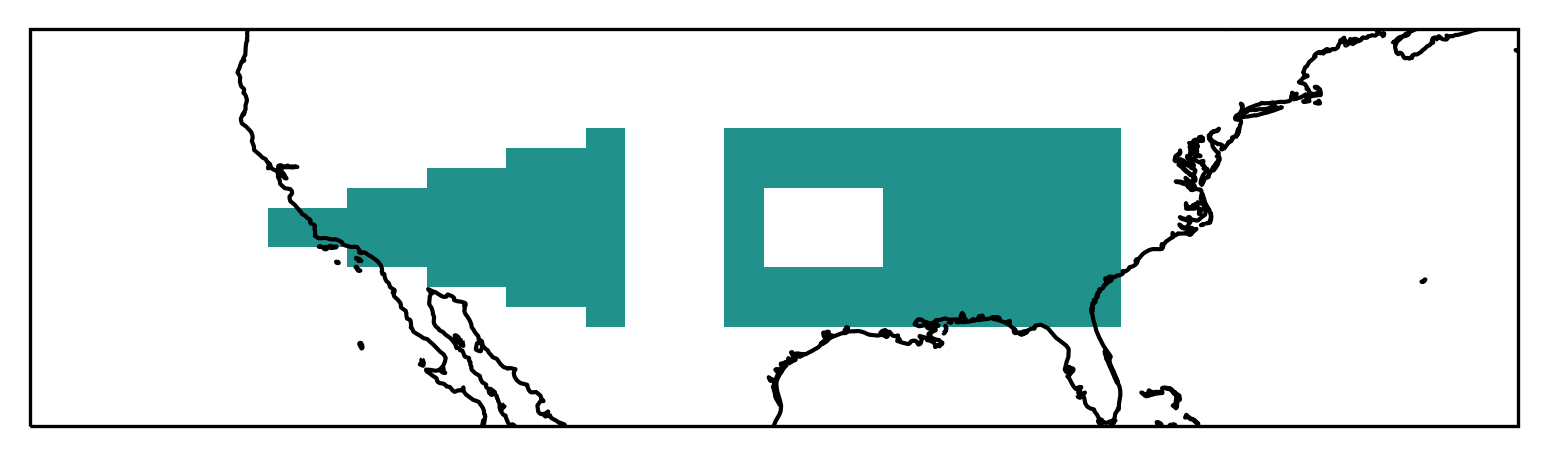
and obtain a mask:
import numpy as np

# define lat/ lon grid
lon = np.arange(200.5, 330, 1)
lat = np.arange(74.5, 15, -1)

mask = USregions.mask(lon, lat)
ax = plt.subplot(111, projection=ccrs.PlateCarree())

h = mask.plot(
    transform=ccrs.PlateCarree(),
    cmap="Paired",
    add_colorbar=False,
    vmax=12,
)

ax.coastlines()

# add the outlines of the regions
USregions.plot_regions(ax=ax, add_label=False)

ax.set_extent([225, 300, 25, 45], crs=ccrs.PlateCarree())
Use shapely Polygon
You can also define the region with shapely polygons (see geopandas tutorial how to work with shapefiles).
from shapely.geometry import Polygon, MultiPolygon

US1_poly = Polygon(US1)
US2_poly = Polygon(US2)

US1_poly, US2_poly
(<POLYGON ((-100 30, -100 40, -120 35, -100 30))>,
 <POLYGON ((-100 30, -80 30, -80 40, -100 40, -100 30))>)
USregions_poly = regionmask.Regions([US1_poly, US2_poly])

USregions_poly
<regionmask.Regions 'unnamed'>
overlap:  False

Regions:
0 r0 Region0
1 r1 Region1

[2 regions]
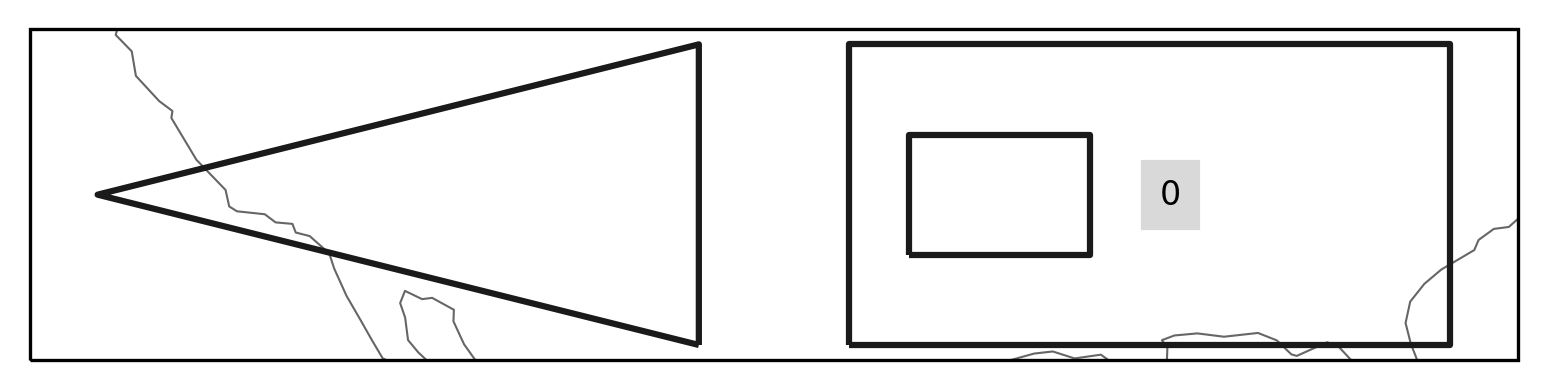
Create Regions with MultiPolygon and interiors
Create two discontiguous regions and combine them to one. Add a hole to one of the regions
US1_shifted = US1 - (5, 0)
US2_hole = np.array([[-98.0, 33], [-92, 33], [-92, 37], [-98, 37], [-98.0, 33]])
Create Polygons, a MultiPolygon, and finally Regions
US1_poly = Polygon(US1_shifted)
US2_poly = Polygon(US2, holes=[US2_hole])

US_multipoly = MultiPolygon([US1_poly, US2_poly])

USregions_poly = regionmask.Regions([US_multipoly])
USregions_poly.plot();
Create a mask:
mask = USregions_poly.mask(lon, lat)
and plot it:
ax = plt.subplot(111, projection=ccrs.PlateCarree())

mask.plot(transform=ccrs.PlateCarree(), add_colorbar=False)

ax.coastlines()

# fine tune the extent
ax.set_extent([225, 300, 25, 45], crs=ccrs.PlateCarree())