None
Note
This tutorial was generated from an IPython notebook that can be downloaded here.
Create your own region
Note
In version 0.5 the Regions_cls has been renamed to Regions and it’s call signature has changed. All arguments (except outlines) are now optional.
Creating own regions is straightforward. Import regionmask and check the version:
import regionmask

regionmask.__version__
'0.7.0'
Import numpy
import numpy as np
Assume you have two custom regions in the US, you can easily use these
to create Regions:
US1 = np.array([[-100.0, 30], [-100, 40], [-120, 35]])
US2 = np.array([[-100.0, 30], [-80, 30], [-80, 40], [-100, 40]])

regionmask.Regions([US1, US2])
<regionmask.Regions>
Name:     unnamed

Regions:
0 r0 Region0
1 r1 Region1

[2 regions]
If you want to set the names and abbrevs yourself you can still
do that:
names = ["US_west", "US_east"]
abbrevs = ["USw", "USe"]

USregions = regionmask.Regions([US1, US2], names=names, abbrevs=abbrevs, name="US")
USregions
<regionmask.Regions>
Name:     US

Regions:
0 USw US_west
1 USe US_east

[2 regions]
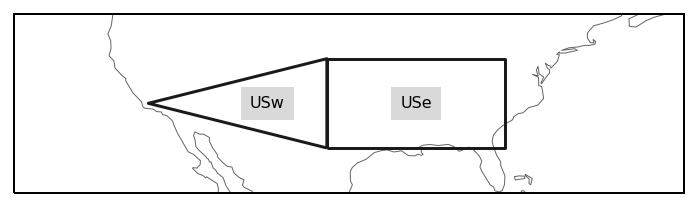
Again we can plot the outline of the defined regions
ax = USregions.plot(label="abbrev")

# load cartopy
import cartopy.crs as ccrs

# fine tune the extent
ax.set_extent([225, 300, 25, 45], crs=ccrs.PlateCarree())
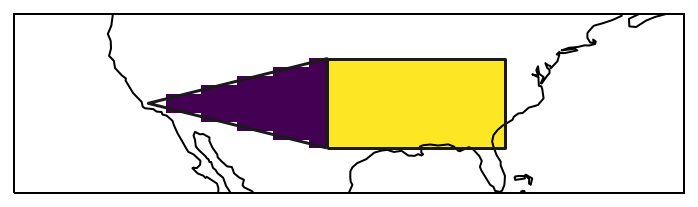
and obtain a mask:
import numpy as np

# define lat/ lon grid
lon = np.arange(200.5, 330, 1)
lat = np.arange(74.5, 15, -1)

# for the plotting
lon_edges = np.arange(200, 331, 1)
lat_edges = np.arange(75, 14, -1)

mask = USregions.mask(lon, lat)
import matplotlib.pyplot as plt

ax = plt.subplot(111, projection=ccrs.PlateCarree())

# pcolormesh does not handle NaNs, requires masked array
mask_ma = np.ma.masked_invalid(mask)

h = ax.pcolormesh(
    lon_edges, lat_edges, mask_ma, transform=ccrs.PlateCarree(), cmap="viridis",
)

ax.coastlines()

# add the outlines of the regions
USregions.plot_regions(ax=ax, add_label=False)

ax.set_extent([225, 300, 25, 45], crs=ccrs.PlateCarree())
Use shapely Polygon
If you have the region defined as a shapely polygon, this also works:
from shapely.geometry import Polygon, MultiPolygon

US1_poly = Polygon(US1)
US2_poly = Polygon(US2)

US1_poly, US2_poly
(<shapely.geometry.polygon.Polygon at 0x7f90e108bfd0>,
 <shapely.geometry.polygon.Polygon at 0x7f90e108bf90>)
USregions_poly = regionmask.Regions([US1_poly, US2_poly])

USregions_poly
<regionmask.Regions>
Name:     unnamed

Regions:
0 r0 Region0
1 r1 Region1

[2 regions]
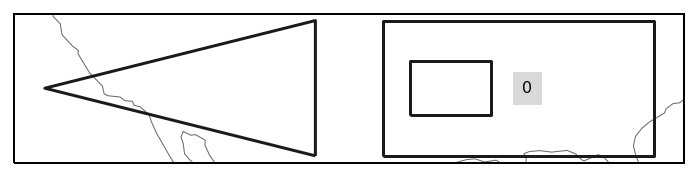
Create Regions with MultiPolygon and interiors
Create two discontiguous regions and combine them to one. Add a hole to one of the regions
US1_shifted = US1 - (5, 0)
US2_hole = np.array([[-98.0, 33], [-92, 33], [-92, 37], [-98, 37], [-98.0, 33]])
Create Polygons, a MultiPolygon, and finally Regions
US1_poly = Polygon(US1_shifted)
US2_poly = Polygon(US2, holes=[US2_hole])

US_multipoly = MultiPolygon([US1_poly, US2_poly])

USregions_poly = regionmask.Regions([US_multipoly])
USregions_poly.plot();
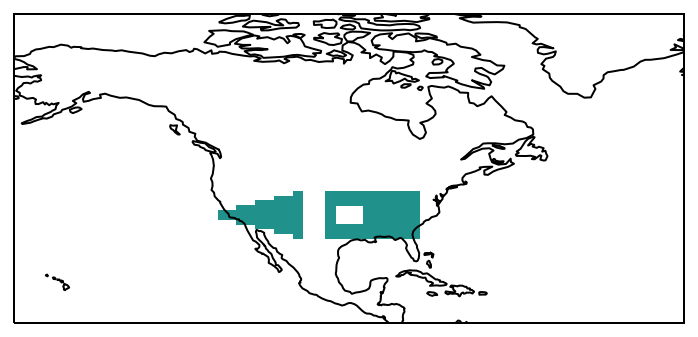
Create a mask:
mask = USregions_poly.mask(lon, lat)
and plot it:
ax = plt.subplot(111, projection=ccrs.PlateCarree())

mask.plot(transform=ccrs.PlateCarree(), add_colorbar=False)

ax.coastlines();