None
Note
This tutorial was generated from an IPython notebook that can be downloaded here.
Plotting
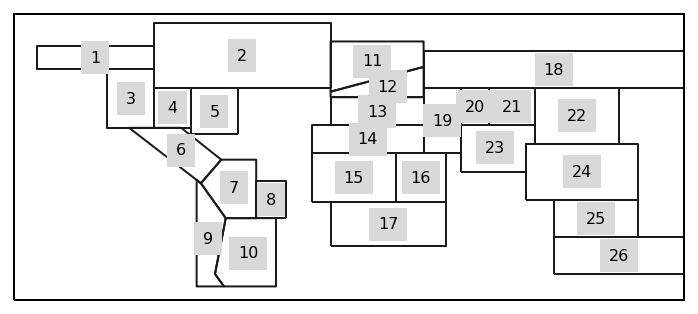
Every region has a plotting function, that draws the outline of all (or selected) regions on a cartopy map. We use the predefined SREX regions as example.
Import regionmask and check the version:
import regionmask

regionmask.__version__
'0.6.2'
Plot all regions
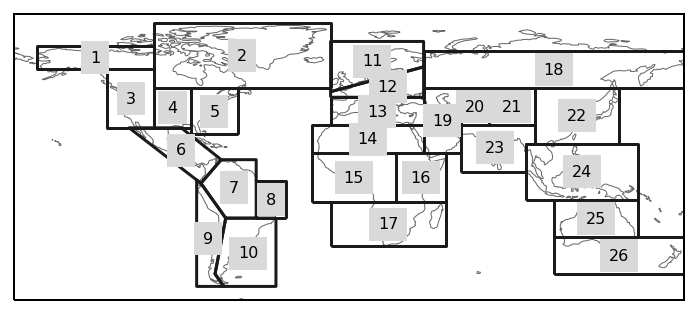
Do the default plot.
regionmask.defined_regions.srex.plot();
<cartopy.mpl.geoaxes.GeoAxesSubplot at 0x7fc37f81ce90>
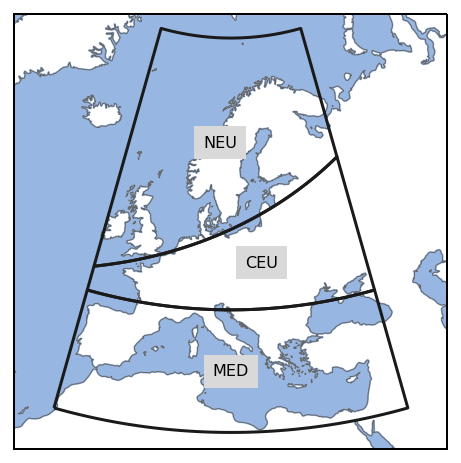
Plot only a Subset of Regions
# load cartopy
import cartopy.crs as ccrs

# regions can be selected by number, abbreviation or long name
regions = [11, "CEU", "S. Europe/Mediterranean"]

# choose a good projection for regional maps
proj = ccrs.LambertConformal(central_longitude=15)

# do the plot
ax = regionmask.defined_regions.srex.plot(
    regions=regions, add_ocean=True, resolution="50m", proj=proj, label="abbrev"
)

# fine tune the extent
ax.set_extent([-15, 45, 28, 76], crs=ccrs.PlateCarree())
Plotting the region outlines only (no map)
regionmask.defined_regions.srex.plot_regions();
<matplotlib.axes._subplots.AxesSubplot at 0x7fc370d3ff50>
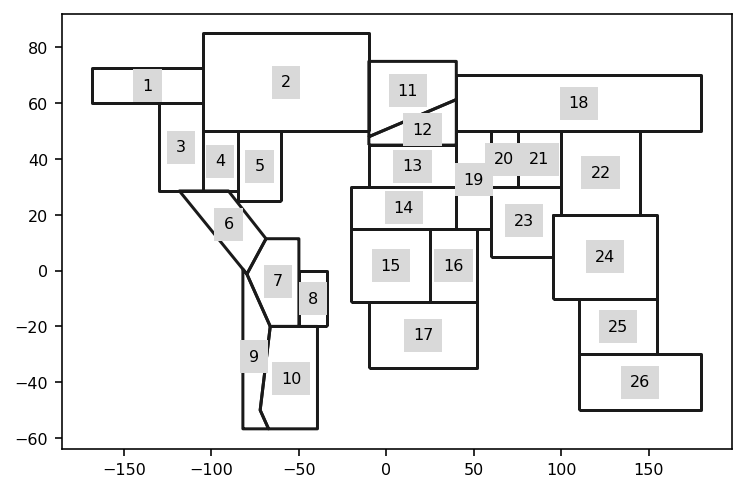
Note
This does not create a cartopy axes.
To achieve this, you need to explicitely create the axes:
import matplotlib.pyplot as plt

f, ax = plt.subplots(subplot_kw=dict(projection=ccrs.PlateCarree()))

regionmask.defined_regions.srex.plot_regions(ax=ax, line_kws=dict(lw=1));
<cartopy.mpl.geoaxes.GeoAxesSubplot at 0x7fc36a96fed0>