Note
This tutorial was generated from an IPython notebook that can be downloaded here.
Multidimensional coordinates
Multidimensional coordinates with xarray
Regionmask can also handle mutltidimensional longitude/ latitude grids (e.g. from a regional climate model). As xarray provides such an example dataset, we will use it to illustrate it. See also in the xarray documentation.
Import regionmask and check the version:
import regionmask
regionmask.__version__
'0.4.0'
Load xarray and the tutorial data:
import xarray as xr
import numpy as np
rasm = xr.tutorial.load_dataset('rasm')
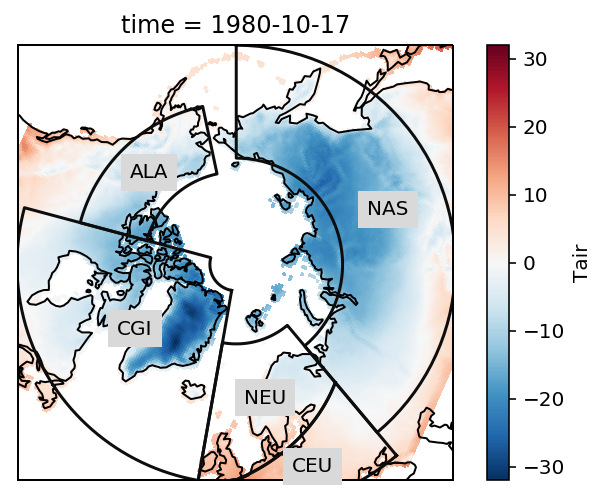
The example data is a temperature field over the Northern Hemisphere. Let’s plot the first time step:
# load plotting libraries
import matplotlib.pyplot as plt
import cartopy.crs as ccrs

# choose a projection
proj=ccrs.NorthPolarStereo()

ax = plt.subplot(111, projection=proj)
ax.set_global()

rasm.isel(time=1).Tair.plot.pcolormesh(ax=ax, x='xc', y='yc', transform=ccrs.PlateCarree())

# add the abbreviation of the regions
regionmask.defined_regions.srex.plot(ax=ax, regions=[1, 2, 11, 12, 18],
                                     add_ocean=False, coastlines=False, label='abbrev')

ax.set_extent([-180, 180, 50, 90], ccrs.PlateCarree())

ax.coastlines();
Again we pass the xarray object to regionmask. We have to specify xc
and yc as the longitude and latitude coordinates of the array:
mask = regionmask.defined_regions.srex.mask(rasm, lon_name='xc', lat_name='yc', wrap_lon=True)
mask
<xarray.DataArray (y: 205, x: 275)>
array([[nan, nan, nan, ...,  5.,  5.,  5.],
       [nan, nan, nan, ...,  5.,  5.,  5.],
       [nan, nan, nan, ...,  5.,  5.,  5.],
       ...,
       [24., 24., 24., ..., 14., 14., 14.],
       [24., 24., 24., ..., 14., 14., 14.],
       [24., 24., 24., ..., 14., 14., 14.]])
Coordinates:
  * y        (y) int64 0 1 2 3 4 5 6 7 8 9 10 11 12 13 14 15 16 17 18 19 20 ...
  * x        (x) int64 0 1 2 3 4 5 6 7 8 9 10 11 12 13 14 15 16 17 18 19 20 ...
    yc       (y, x) float64 16.53 16.78 17.02 17.27 17.51 17.76 18.0 18.25 ...
    xc       (y, x) float64 189.2 189.4 189.6 189.7 189.9 190.1 190.2 190.4 ...
We want to select the region ‘NAS’ (Northern Asia).
Select using where
We have to select by index (the number of the region), we thus map from the abbreviation to the index.
rasm_NAS = rasm.where(mask == regionmask.defined_regions.srex.map_keys('NAS'))
Check everything went well by repeating the first plot with the selected region:
# choose a projection
proj=ccrs.NorthPolarStereo()

ax = plt.subplot(111, projection=proj)
ax.set_global()

rasm_NAS.isel(time=1).Tair.plot.pcolormesh(ax=ax, x='xc', y='yc', transform=ccrs.PlateCarree())


# add the abbreviation of the regions
regionmask.defined_regions.srex.plot(ax=ax, regions=['NAS'],
                                     add_ocean=False, coastlines=False, label='abbrev')

ax.set_extent([-180, 180, 50, 90], ccrs.PlateCarree())

ax.coastlines();
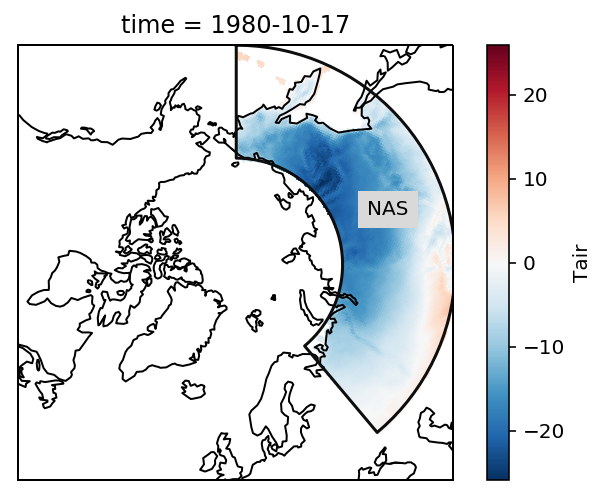
Looks good - now we coould again take the area average.
Multidimensional coordinates with numpy
If you don’t use xarray, the same can be achieved with numpy arrays.
# extract lon and lat
lon = rasm.xc.values
lat = rasm.yc.values
The lon and lat numpy arrays can directly be passed to regionmask (now we create a mask with the countries of the world):
mask = regionmask.defined_regions.natural_earth.countries_110.mask(lon, lat, wrap_lon=True)
mask
<xarray.DataArray (lon_idx: 205, lat_idx: 275)>
array([[nan, nan, nan, ..., nan, nan, nan],
       [nan, nan, nan, ..., nan, nan, nan],
       [nan, nan, nan, ..., nan, nan, nan],
       ...,
       [nan, nan, nan, ..., 93., 93., 93.],
       [nan, nan, nan, ..., 93., 93., 93.],
       [nan, nan, nan, ..., 93., 93., 93.]])
Coordinates:
  * lon_idx  (lon_idx) int64 0 1 2 3 4 5 6 7 8 9 10 11 12 13 14 15 16 17 18 ...
  * lat_idx  (lat_idx) int64 0 1 2 3 4 5 6 7 8 9 10 11 12 13 14 15 16 17 18 ...
    lat      (lon_idx, lat_idx) float64 16.53 16.78 17.02 17.27 17.51 17.76 ...
    lon      (lon_idx, lat_idx) float64 189.2 189.4 189.6 189.7 189.9 190.1 ...
If xarray is installed, regionmask automatically returns a xarray object
even when passing numpy arrays. To get a numpy array, use the
xarray=False keyword.
# mask = regionmask.defined_regions.natural_earth.countries_110.mask(lon, lat, xarray=False, wrap_lon=True)
Or just use mask.values:
mask = mask.values
mask
array([[nan, nan, nan, ..., nan, nan, nan],
       [nan, nan, nan, ..., nan, nan, nan],
       [nan, nan, nan, ..., nan, nan, nan],
       ...,
       [nan, nan, nan, ..., 93., 93., 93.],
       [nan, nan, nan, ..., 93., 93., 93.],
       [nan, nan, nan, ..., 93., 93., 93.]])
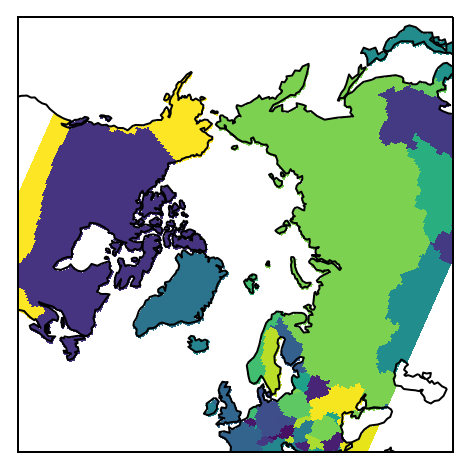
Finally, plot the mask:
proj=ccrs.NorthPolarStereo()

ax = plt.subplot(111, projection=proj)

m = np.ma.masked_invalid(mask)
ax.pcolormesh(lon, lat, m, transform=ccrs.PlateCarree())

ax.set_extent([-180, 180, 45, 90], ccrs.PlateCarree())

ax.coastlines();