Note
This tutorial was generated from an IPython notebook that can be downloaded here.
Plotting
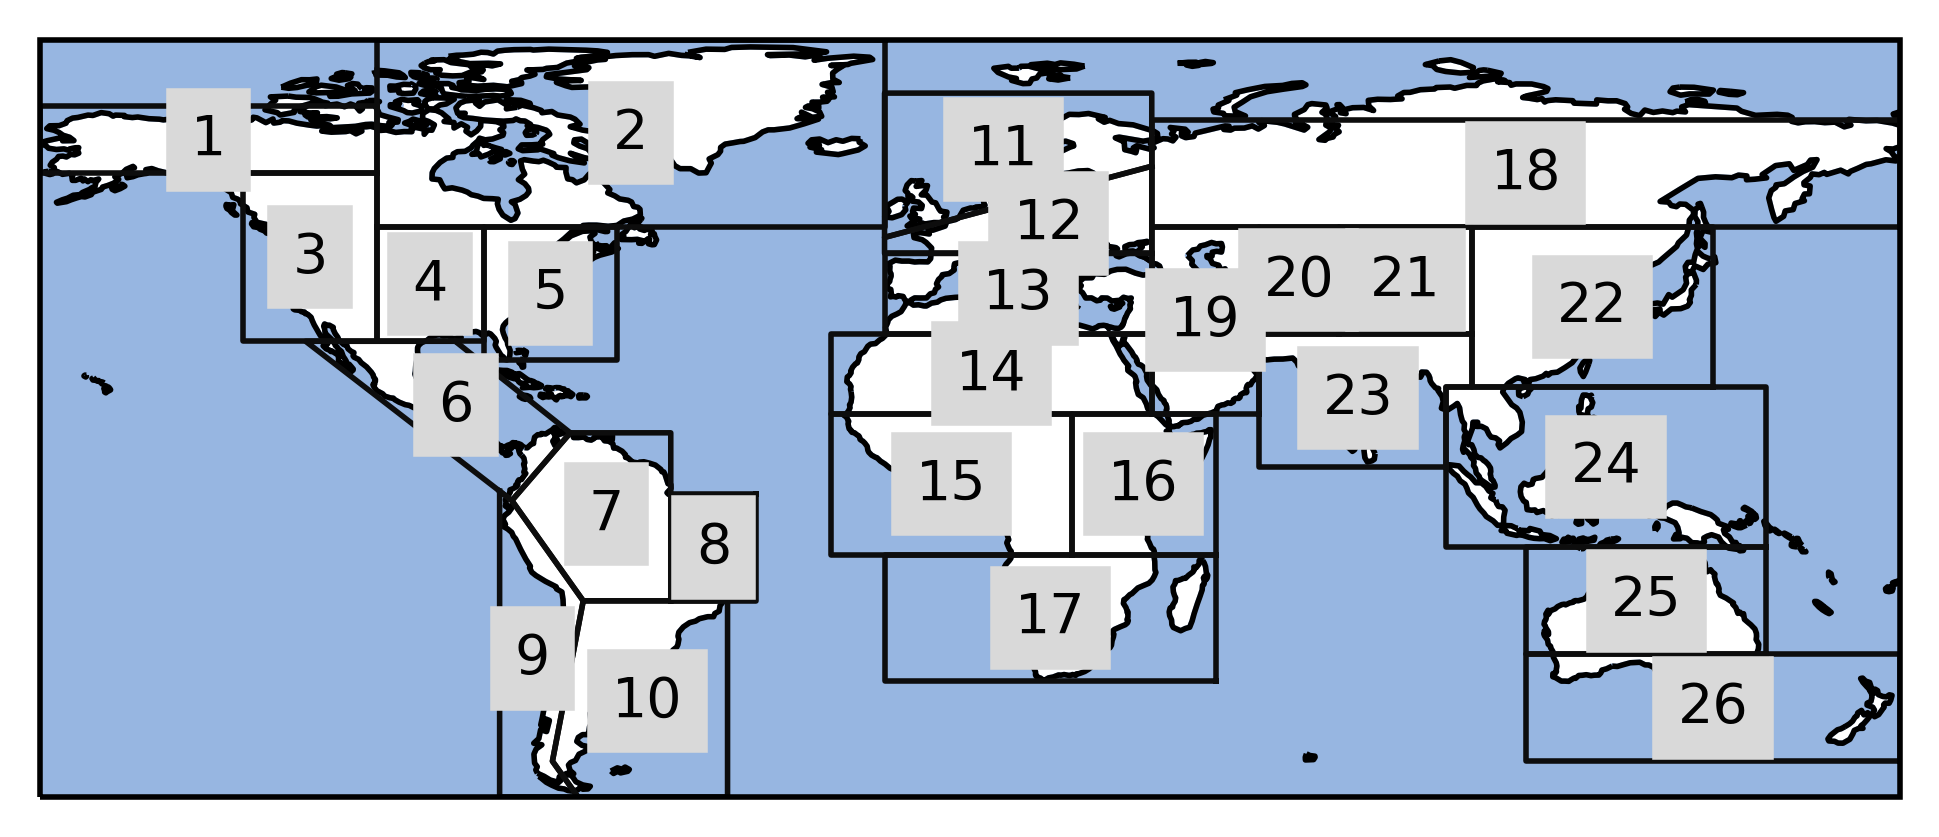
Every region has a plotting function, that draws the outline of all (or selected) regions on a cartopy map. We use the predefined SREX regions as example.
Import regionmask and check the version:
/home/docs/checkouts/readthedocs.org/user_builds/regionmask/conda/v0.2.0/lib/python2.7/site-packages/matplotlib/__init__.py:1357: UserWarning:  This call to matplotlib.use() has no effect
because the backend has already been chosen;
matplotlib.use() must be called before pylab, matplotlib.pyplot,
or matplotlib.backends is imported for the first time.

  warnings.warn(_use_error_msg)
'0.2.0'
Plot all regions
Do the default plot.
<cartopy.mpl.geoaxes.GeoAxesSubplot at 0x7f988e8e0dd0>
/home/docs/checkouts/readthedocs.org/user_builds/regionmask/conda/v0.2.0/lib/python2.7/site-packages/cartopy/io/__init__.py:264: DownloadWarning: Downloading: http://naciscdn.org/naturalearth/110m/physical/ne_110m_ocean.zip
  warnings.warn('Downloading: {}'.format(url), DownloadWarning)
/home/docs/checkouts/readthedocs.org/user_builds/regionmask/conda/v0.2.0/lib/python2.7/site-packages/cartopy/io/__init__.py:264: DownloadWarning: Downloading: http://naciscdn.org/naturalearth/110m/physical/ne_110m_coastline.zip
  warnings.warn('Downloading: {}'.format(url), DownloadWarning)
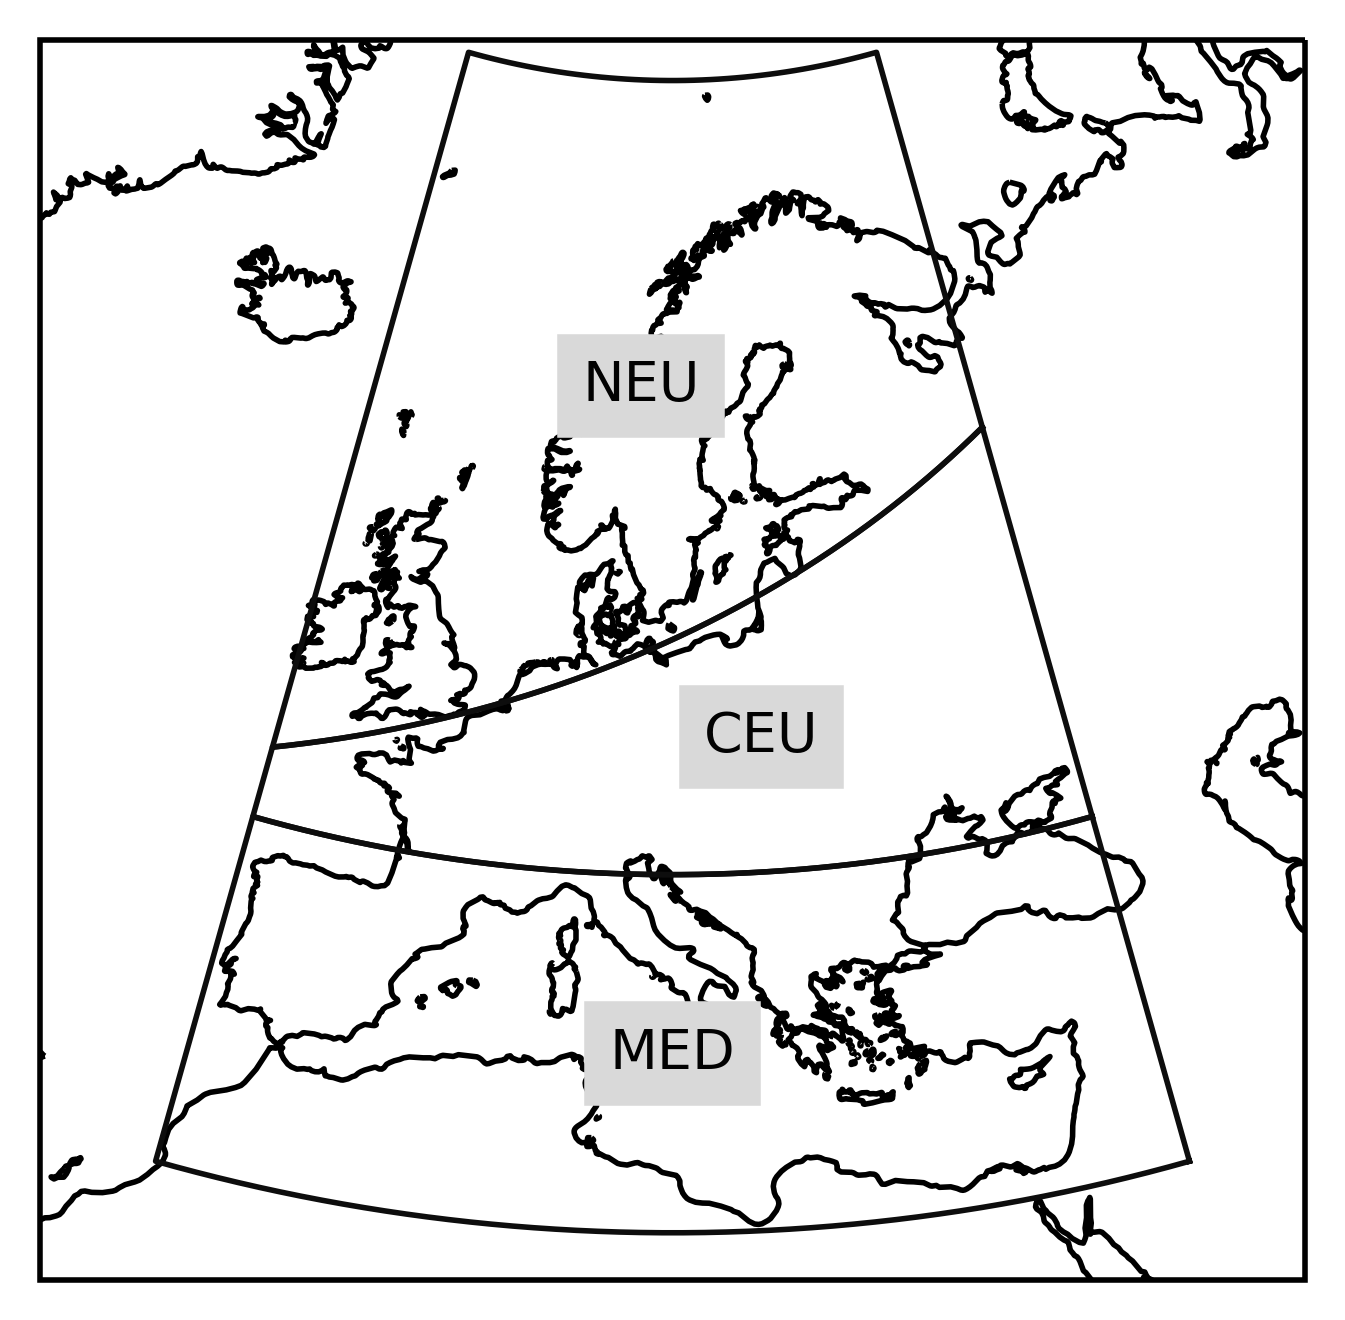
Plot only a Subset of Regions
/home/docs/checkouts/readthedocs.org/user_builds/regionmask/conda/v0.2.0/lib/python2.7/site-packages/cartopy/io/__init__.py:264: DownloadWarning: Downloading: http://naciscdn.org/naturalearth/50m/physical/ne_50m_coastline.zip
  warnings.warn('Downloading: {}'.format(url), DownloadWarning)